Figure (Eplerenone Fig 3)
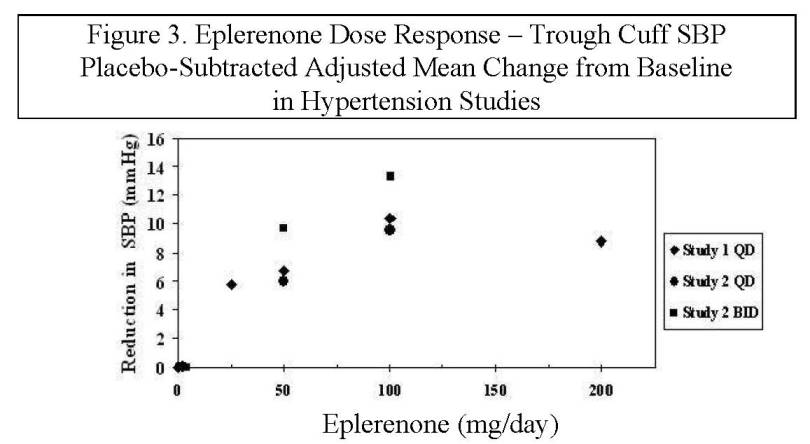
The text describes a figure (Figure 3) that shows the dose-response of Eplerenone, a drug used to treat hypertension. The figure shows the placebo-subtracted adjusted mean change in trough cuff SBP (systolic blood pressure) in hypertension studies. The x-axis of the figure denotes the dosage of Eplerenone ranging from 0 to 200 mg/day, whereas the y-axis represents the mean change in SBP. However, due to the absence of the actual data, it's not possible to infer more details about the figure.*