Brimonidine Gel
Product Images NDC 63629-9616

View Photos of Packaging, Regulatory Labels, and Product Appearance

Product Visual Gallery

This gallery contains 12 technical images submitted to the FDA as part of the official labeling for Brimonidine (NDC 63629-9616). Unlike standard consumer photos, these assets often include clinical data figures, molecular chemical structures, and official manufacturer packaging layouts.

As provided by Bryant Ranch Prepack, these visuals offer a comprehensive scientific overview of the product's physical and chemical identity, aiding pharmacists and researchers in product verification and study.

FDA Label Image

Figure A (Figure A)

Figure A (Figure A)
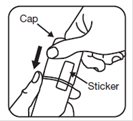
Instructional illustration showing a hand holding a tube of BRIMONIDINE 5 mg/g topical gel and removing the cap and sticker from the tube. The image guides on how to prepare the gel tube for use.*
FDA Label Image

Figure B (Figure B)

Figure B (Figure B)
An instructional illustration showing a hand opening a tube top by pulling back the cap, likely demonstrating how to access the gel inside the tube. The image is a line drawing with clear emphasis on the action of removing the cap from a topical gel container.*
FDA Label Image

Figure C (Figure C)

Figure C (Figure C)
Illustration showing a person pressing a pump dispenser on a topical gel bottle, applying the product to a fingertip. The hand position indicates how to dispense a controlled amount of gel for application.*
FDA Label Image

Figure D (Figure D)

Figure D (Figure D)
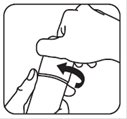
An instructional illustration showing a hand being opened and a second hand peeling off a black protective cover, likely from a tube or gel container. The image appears to demonstrate how to remove the seal or cap from a topical medication container.*
FDA Label Image

Brimonidine Structure.jpg (Image 01)

Brimonidine Structure.jpg (Image 01)
Chemical structure diagram of brimonidine, the active ingredient in BRIMONIDINE 5 mg/g topical gel. The structure displays the arrangement of atoms including bromine, nitrogen, carbon, oxygen, and hydrogen components in brimonidine's molecular formula.*
FDA Label Image

Figure 1 Day 1.jpg (Image 02)

Figure 1 Day 1.jpg (Image 02)
A line graph labeled 'Day 1' comparing composite success percentage over 12 hours for Brimonidine Topical Gel and Vehicle Gel. The vertical axis shows composite success (%) from 0 to 40, and the horizontal axis shows time in hours from 0 to 12. The Brimonidine Topical Gel line rises to a peak near 24% at 6 hours and then gradually declines, while the Vehicle Gel line remains low, under 10%, across all time points.*
FDA Label Image

Figure 1 Day 15.jpg (Image 03)

Figure 1 Day 15.jpg (Image 03)
A line graph titled 'Day 15' showing composite success percentage over time in hours. The horizontal axis ranges from 0 to 12 hours, and the vertical axis shows composite success percentages from 0% to 40%. Two data series are depicted: one with solid circles peaking near 28% around hour 6, then declining, and another with triangles under 10%, staying relatively flat throughout.*
FDA Label Image

Figure 1 Day 29.jpg (Image 04)

Figure 1 Day 29.jpg (Image 04)
A line graph titled 'Day 29' displaying composite success percentages over a 12-hour period. The y-axis represents composite success (%) from 0 to 40%, and the x-axis shows time in hours (0, 3, 6, 9, 12). Two data series are shown: a solid line with circular markers rising sharply to about 32% at hour 3, then gradually decreasing to around 23% at hour 12; and a dashed line with triangular markers fluctuating roughly between 9% and 11% across the same timeframe.*
FDA Label Image

Figure 2 Day 1.jpg (Image 05)

Figure 2 Day 1.jpg (Image 05)
A line chart comparing composite success rates (%) over a 12-hour period on Day 1 between Brimonidine Topical Gel and Vehicle Gel. The x-axis represents time in hours (0, 3, 6, 9, 12), while the y-axis shows composite success percentage, ranging from 0 to 40%. Brimonidine Topical Gel shows a peak near 29% success around 6 hours, then declines, while Vehicle Gel remains near 0% throughout.*
FDA Label Image

Figure 2 Day 15.jpg (Image 06)

Figure 2 Day 15.jpg (Image 06)
A line graph labeled 'Day 15' showing Composite Success (%) on the y-axis versus Hour on the x-axis. The graph features two lines: one with solid circles peaking around 25-27% and the other with triangles increasing to about 8%, both tracked over a 0 to 12 hour period.*
FDA Label Image

Figure 2 Day 29.jpg (Image 07)

Figure 2 Day 29.jpg (Image 07)
A line graph titled 'Day 29' showing composite success percentage over hours (0, 3, 6, 9, 12). Two data series are displayed with different markers (circles and triangles). The composite success varies with time, peaking around 3 to 6 hours for the circle marker series and remaining lower with slight increase for the triangle marker series.*
FDA Label Image

Label (Lbl636299616)

Label (Lbl636299616)
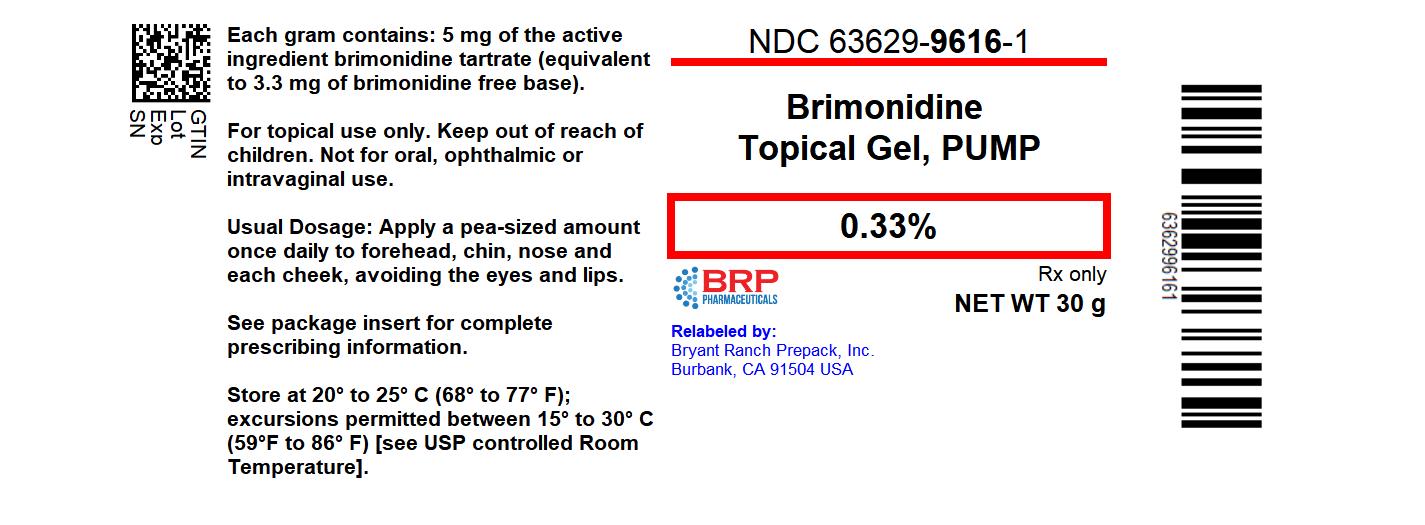
Brimonidine Topical Gel, 0.33%, in a pump dispenser format. The label shows the net weight as 30 g and indicates that it is for prescription use only. It includes the NDC 63629-9616-1 and is relabeled by Bryant Ranch Prepack, Inc., Burbank, CA. The label also provides storage instructions and indicates this is a topical gel form.*

* About these descriptions: Image descriptions on this page are generated by automated AI analysis of the product label images from the manufacturer's FDA label submission (SPL). They are provided for reference only and may contain errors or omissions. Always rely on the printed label itself and the official FDA labeling, and consult a pharmacist or healthcare professional with any questions about this product.