Bortezomib Injection
Product Images NDC 63759-3032

View Photos of Packaging, Regulatory Labels, and Product Appearance

Product Visual Gallery

This gallery contains 11 technical images submitted to the FDA as part of the official labeling for Bortezomib (NDC 63759-3032). Unlike standard consumer photos, these assets often include clinical data figures, molecular chemical structures, and official manufacturer packaging layouts.

As provided by Shilpa Medicare Limited, these visuals offer a comprehensive scientific overview of the product's physical and chemical identity, aiding pharmacists and researchers in product verification and study.

FDA Label Image

Image (71ebcbb5 31e2 4394 8a38 D833fd3c733a 01)
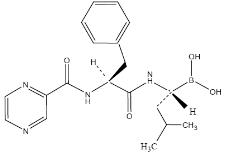
Image (71ebcbb5 31e2 4394 8a38 D833fd3c733a 01)
Chemical structure of Bortezomib showing the molecular arrangement of atoms, including boron, nitrogen, oxygen, carbon, and hydrogen atoms depicted with their bonds.*
FDA Label Image

Image (71ebcbb5 31e2 4394 8a38 D833fd3c733a 02)

Image (71ebcbb5 31e2 4394 8a38 D833fd3c733a 02)
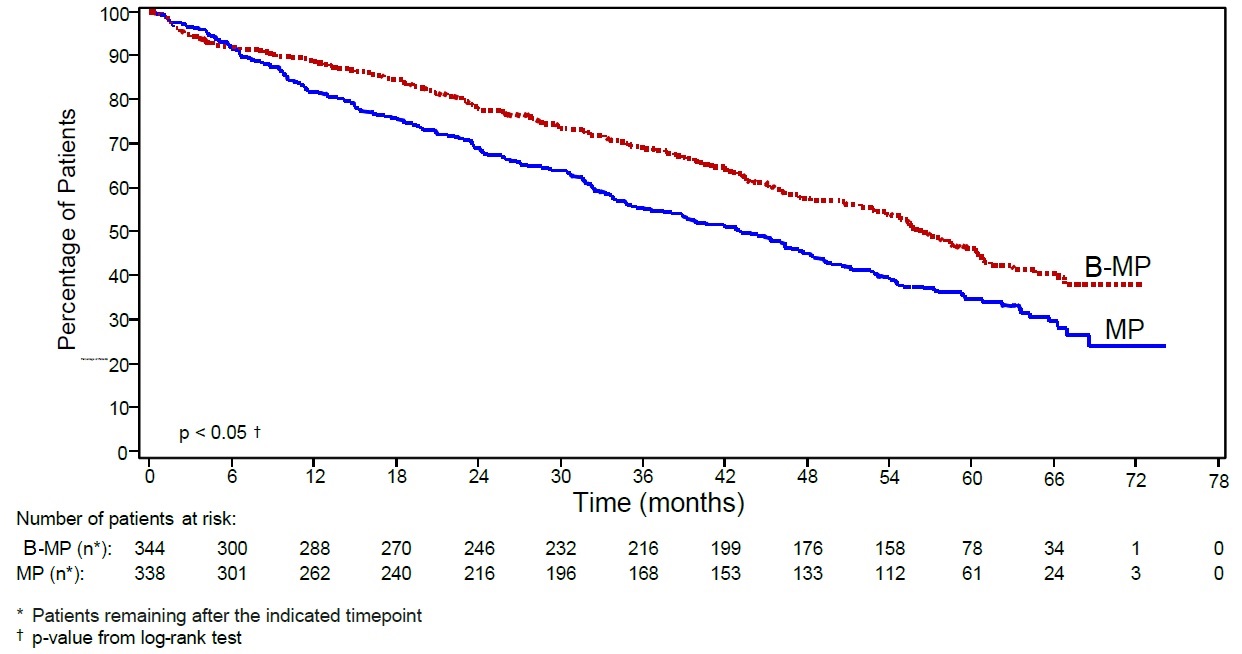
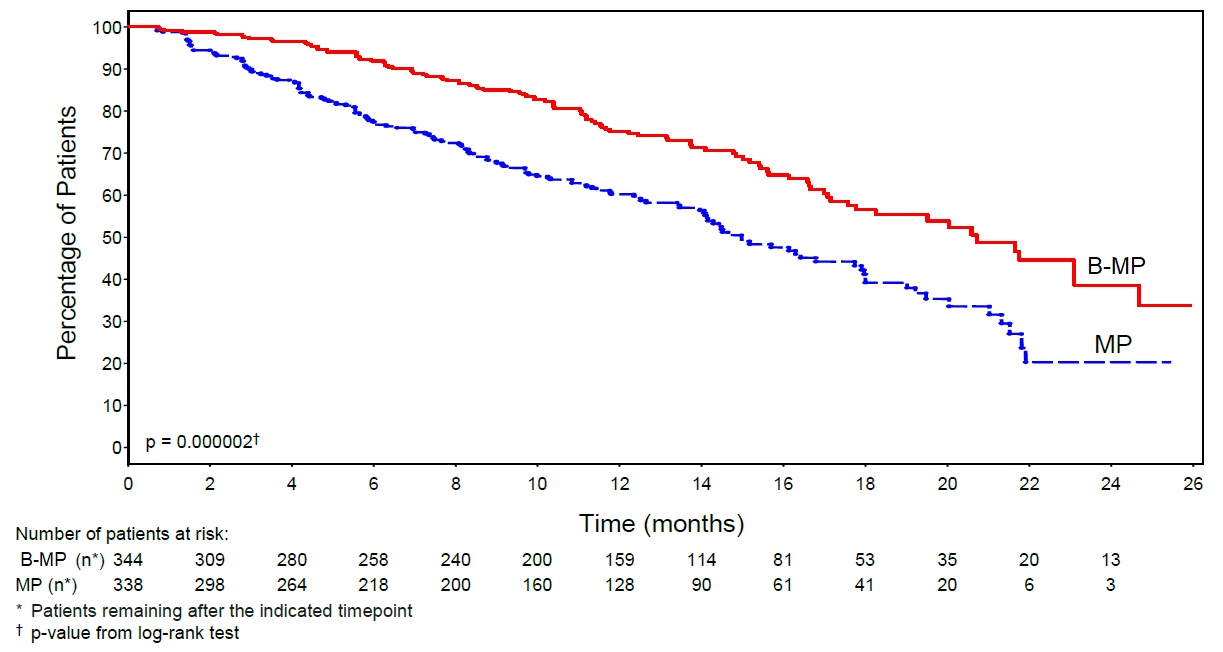
A survival curve chart depicting the percentage of patients over time in months, comparing two groups labeled B-MP (red solid line) and MP (blue dashed line). The chart includes a table of the number of patients at risk at various time points for each group and a p-value of 0.000002 from a log-rank test indicating statistical difference between groups.*
FDA Label Image

Image (71ebcbb5 31e2 4394 8a38 D833fd3c733a 03)

Image (71ebcbb5 31e2 4394 8a38 D833fd3c733a 03)
A Kaplan-Meier survival curve chart showing the percentage of patients over time (in months) for two groups labeled B-MP and MP. The chart includes patient numbers at risk below the x-axis and a noted p-value from a log-rank test indicating statistical comparison between groups.*
FDA Label Image

Image (71ebcbb5 31e2 4394 8a38 D833fd3c733a 04)

Image (71ebcbb5 31e2 4394 8a38 D833fd3c733a 04)
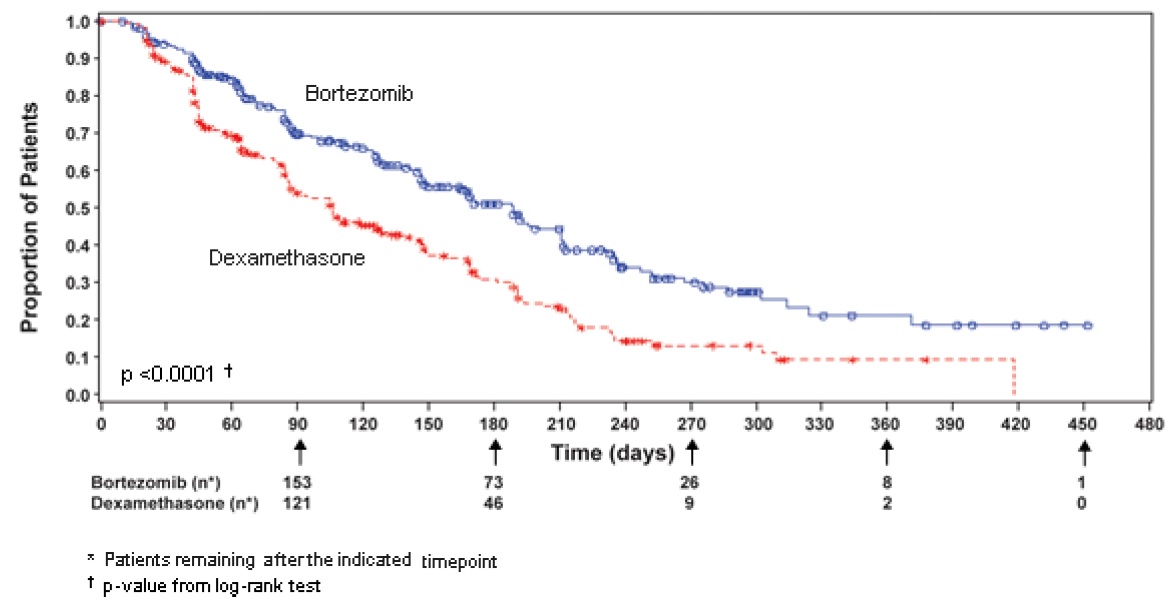
A Kaplan-Meier survival curve showing the proportion of patients over time (days) comparing Bortezomib and Dexamethasone treatment groups. The graph plots patient survival proportions from 0 to about 480 days, with Bortezomib represented by a blue line and Dexamethasone by a red line. Patient counts at several time points and a p-value from a log-rank test are shown below the x-axis.*
FDA Label Image

Image (71ebcbb5 31e2 4394 8a38 D833fd3c733a 05)

Image (71ebcbb5 31e2 4394 8a38 D833fd3c733a 05)
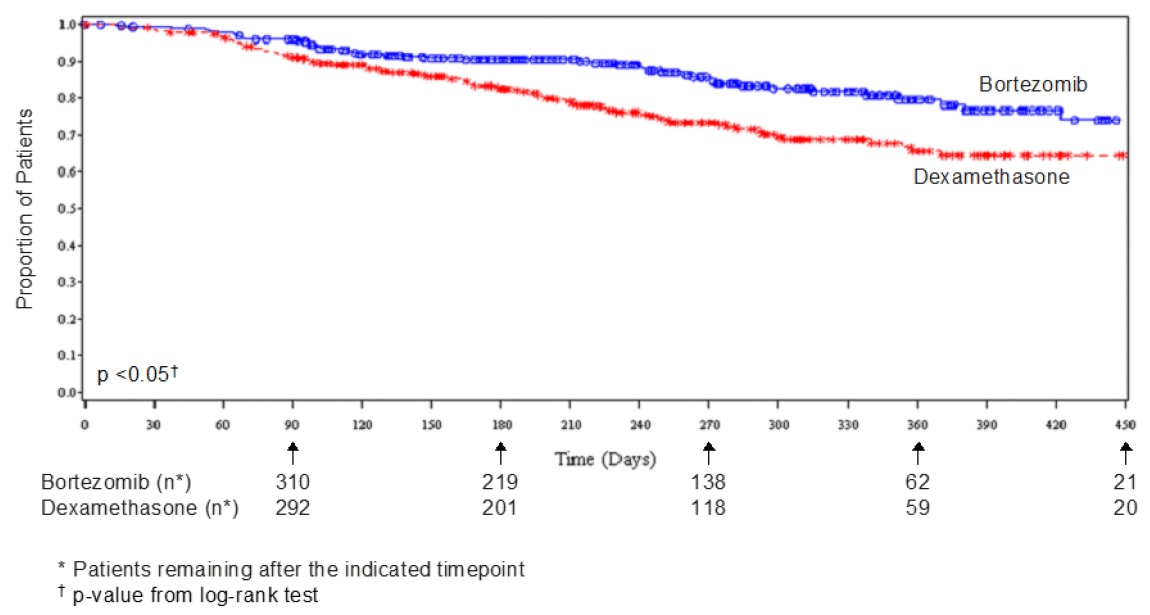
A Kaplan-Meier survival curve comparing the proportion of patients over time (days) between Bortezomib and Dexamethasone treatments. The graph shows patient counts at various time points with Bortezomib represented by blue circles and Dexamethasone by red crosses. A p-value less than 0.05 from a log-rank test is indicated.*
FDA Label Image

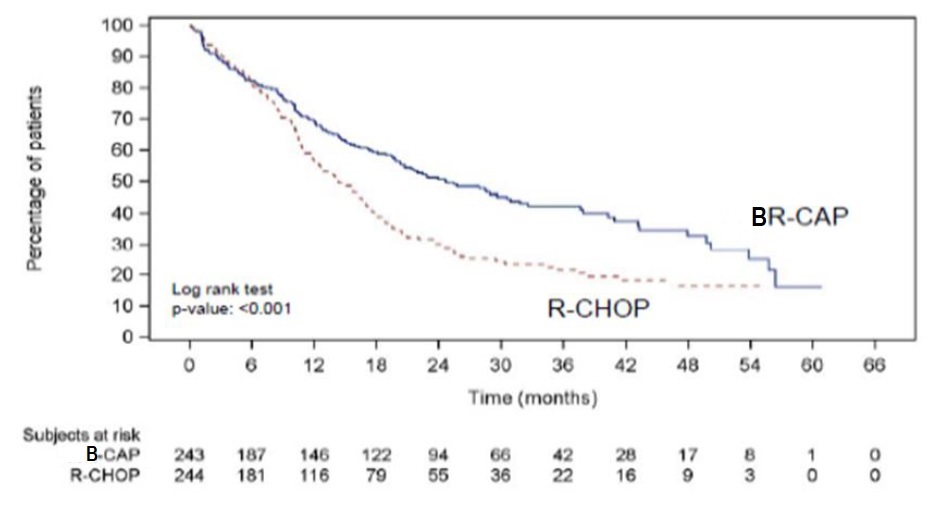
Figure 5: Progression-free Survival Vcr-cap Vs R-chop (previously Untreated Mantle Cell Lymphoma Study) (71ebcbb5 31e2 4394 8a38 D833fd3c733a 06)

Figure 5: Progression-free Survival Vcr-cap Vs R-chop (previously Untreated Mantle Cell Lymphoma Study) (71ebcbb5 31e2 4394 8a38 D833fd3c733a 06)
A survival curve line graph comparing two treatment groups, BR-CAP and R-CHOP, showing percentage of patients over time in months. BR-CAP line remains higher than R-CHOP, indicating greater survival percentage. Below the graph is a table showing numbers of subjects at risk at various time points for both groups. The graph includes a log rank test p-value less than 0.001.*
FDA Label Image

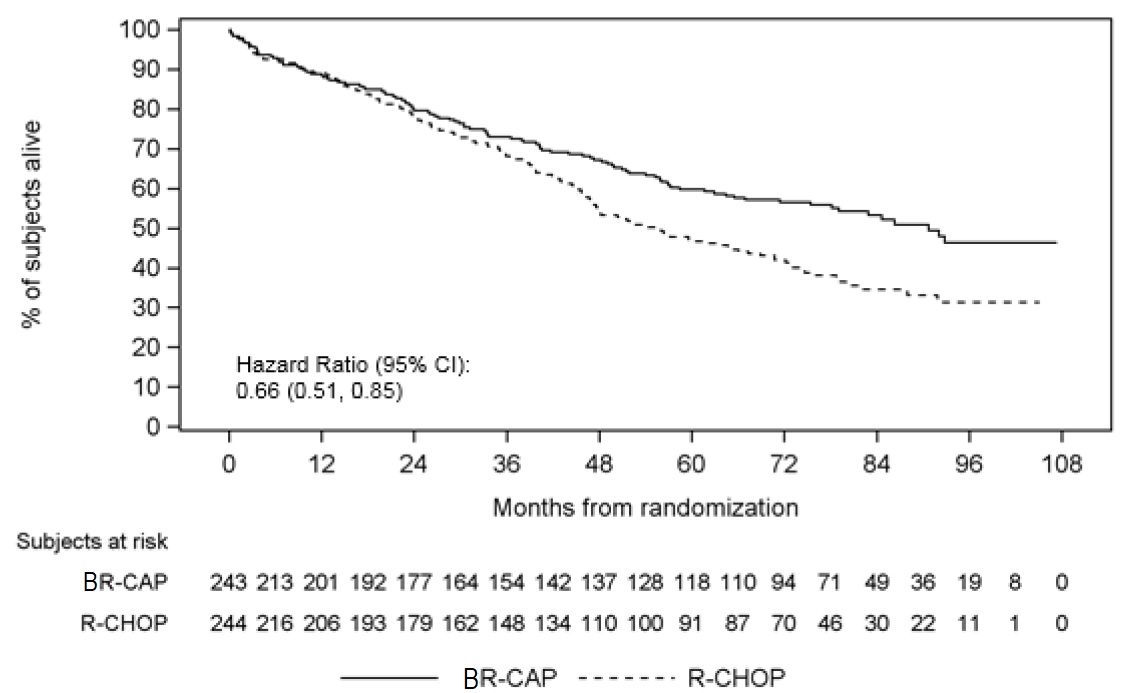
Figure 6: Overall Survival Vcr-cap Vs R-chop (previously Untreated Mantle Cell Lymphoma Study) (71ebcbb5 31e2 4394 8a38 D833fd3c733a 07)

Figure 6: Overall Survival Vcr-cap Vs R-chop (previously Untreated Mantle Cell Lymphoma Study) (71ebcbb5 31e2 4394 8a38 D833fd3c733a 07)
A Kaplan-Meier survival curve comparing % of subjects alive over months from randomization between two treatment groups, BR-CAP (solid line) and R-CHOP (dashed line). The chart includes the number of subjects at risk over time and reports a hazard ratio of 0.66 (95% CI: 0.51, 0.85).*
FDA Label Image

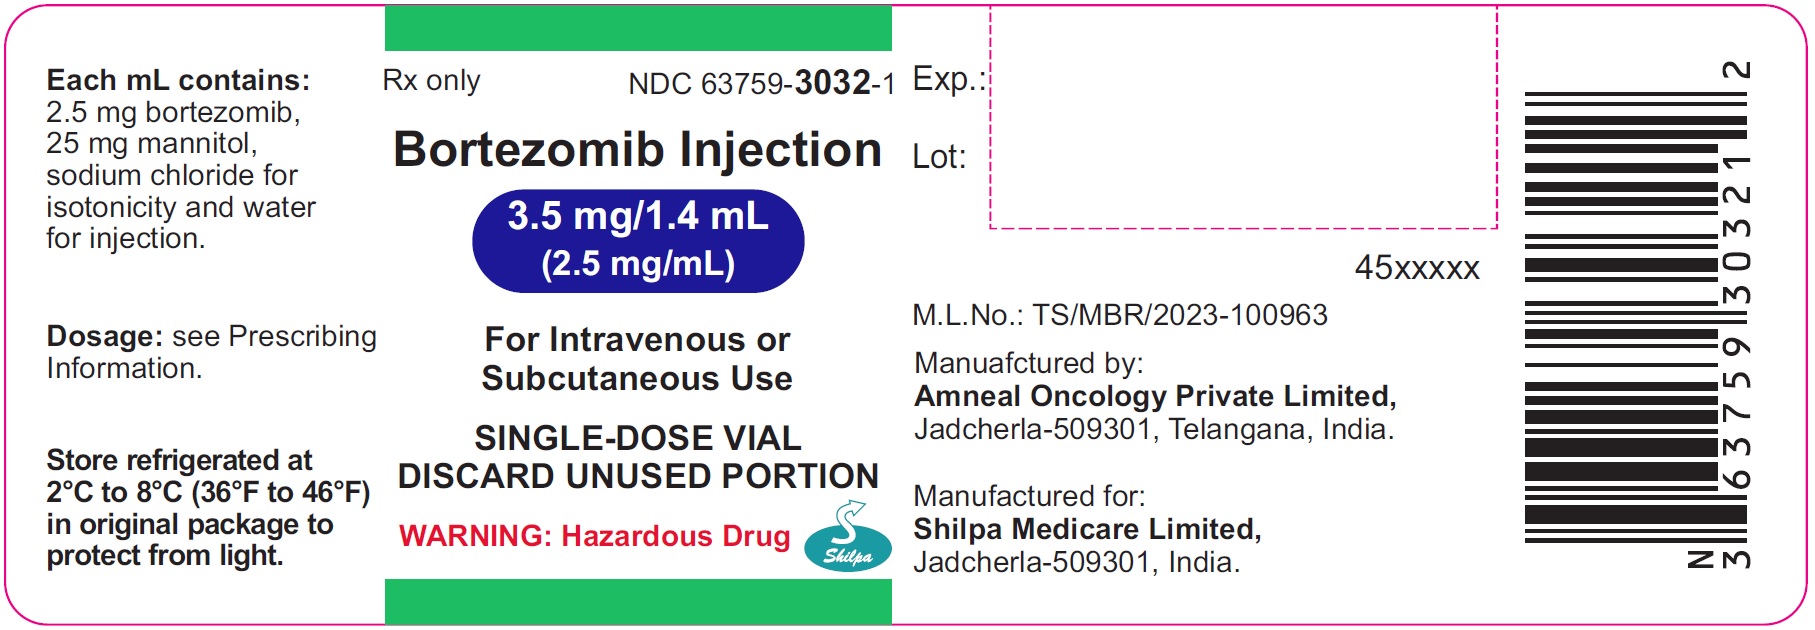
Bortezomib Injection 3.5 mg/1.4 mL (71ebcbb5 31e2 4394 8a38 D833fd3c733a 08)

Bortezomib Injection 3.5 mg/1.4 mL (71ebcbb5 31e2 4394 8a38 D833fd3c733a 08)
Label for Bortezomib Injection 3.5 mg/1.4 mL (2.5 mg/mL) single-dose vial by Shilpa Medicare Limited. The label states the drug is for intravenous or subcutaneous use, includes storage instructions (2°C to 8°C), and notes it contains 2.5 mg bortezomib per mL with mannitol and sodium chloride. Manufactured by Amneal Oncology Private Limited in India.*
FDA Label Image

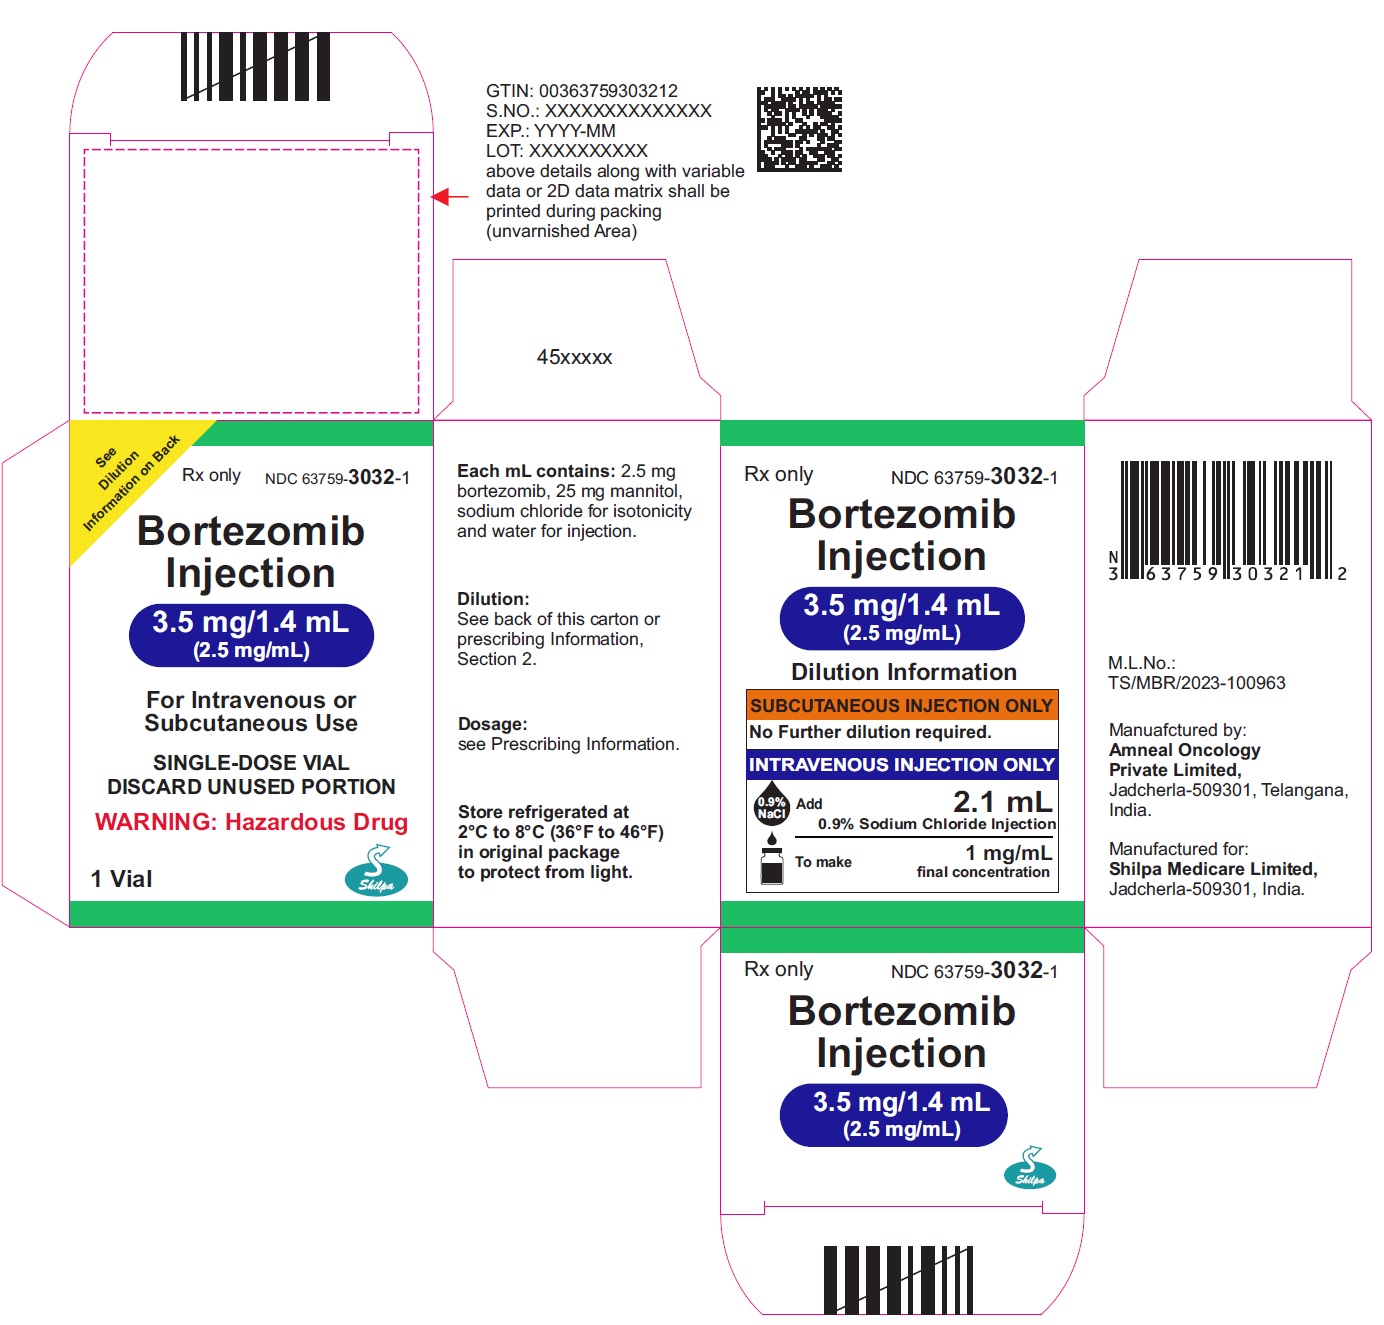
Bortezomib Injection 3.5 mg/1.4 mL (71ebcbb5 31e2 4394 8a38 D833fd3c733a 09)

Bortezomib Injection 3.5 mg/1.4 mL (71ebcbb5 31e2 4394 8a38 D833fd3c733a 09)
Packaging label for Bortezomib Injection 3.5 mg/1.4 mL (2.5 mg/mL) by Shilpa Medicare Limited. It is a single-dose vial for intravenous or subcutaneous use, labeled as Rx only and includes dilution information for subcutaneous and intravenous injections. The label warns that it is a hazardous drug and provides storage instructions to keep refrigerated between 2°C and 8°C (36°F to 46°F). Manufacturer details show Amneal Oncology Private Limited in Telangana, India.*
FDA Label Image

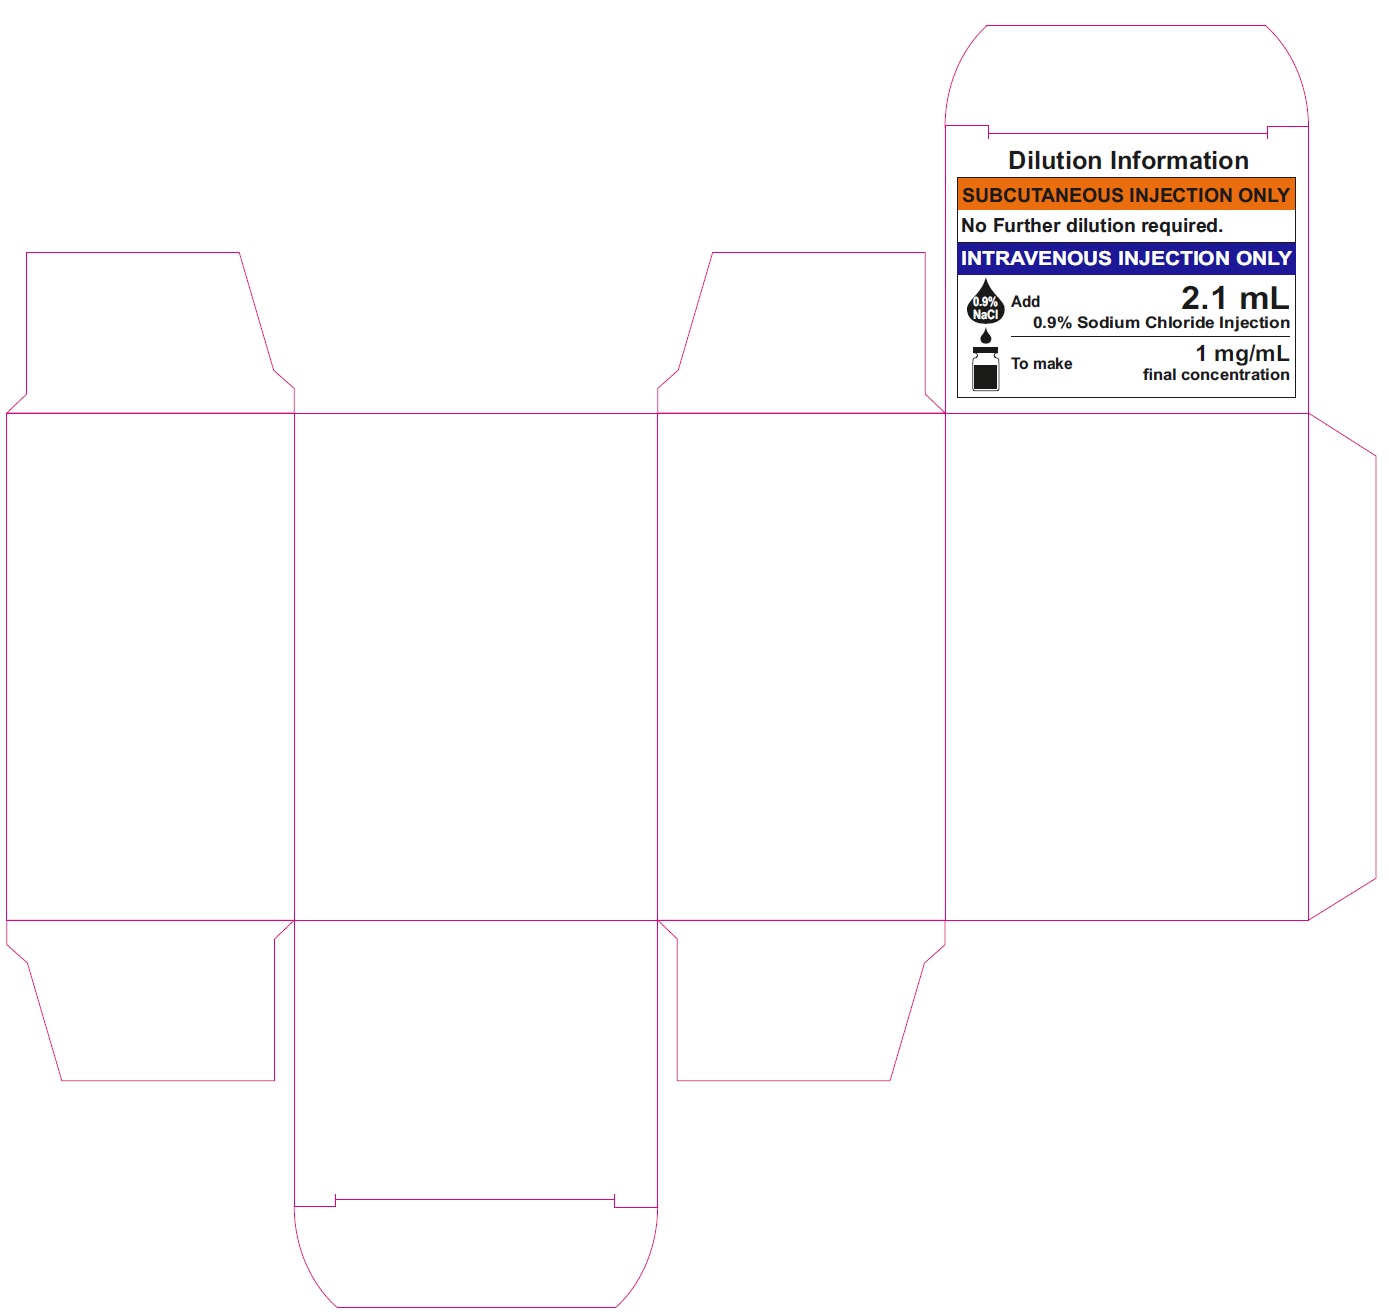
Bortezomib Injection 3.5 mg/0.2ml (71ebcbb5 31e2 4394 8a38 D833fd3c733a 10)

Bortezomib Injection 3.5 mg/0.2ml (71ebcbb5 31e2 4394 8a38 D833fd3c733a 10)
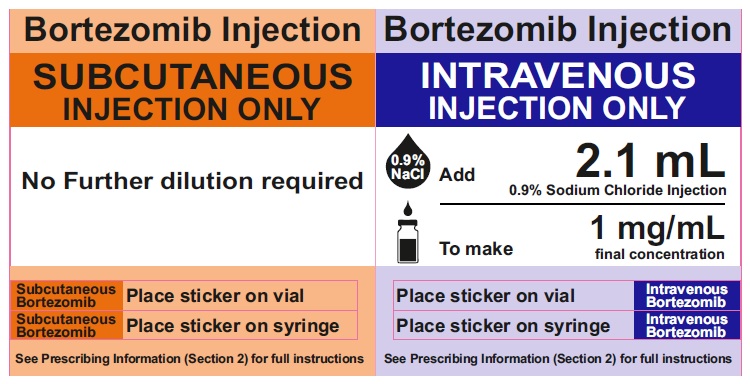
Dilution information label for Bortezomib injection by Shilpa Medicare Limited. The label details preparation instructions stating no dilution is required for subcutaneous injection, while intravenous injection requires adding 2.1 mL of 0.9% sodium chloride injection to achieve a final concentration of 1 mg/mL.*
FDA Label Image

Bortezomib Injection 3.5 mg/1.4 mL (71ebcbb5 31e2 4394 8a38 D833fd3c733a 11)

Bortezomib Injection 3.5 mg/1.4 mL (71ebcbb5 31e2 4394 8a38 D833fd3c733a 11)
A drug information panel for Bortezomib Injection showing separate instructions for subcutaneous and intravenous administration. The subcutaneous section states "No Further dilution required" and instructs to place stickers on vial and syringe. The intravenous section instructs adding 0.9% sodium chloride injection to make a 2.1 mL solution at 1 mg/mL final concentration, with similar placement instructions for stickers. Both sections reference prescribing information for full instructions.*

* About these descriptions: Image descriptions on this page are generated by automated AI analysis of the product label images from the manufacturer's FDA label submission (SPL). They are provided for reference only and may contain errors or omissions. Always rely on the printed label itself and the official FDA labeling, and consult a pharmacist or healthcare professional with any questions about this product.