Everolimus Tablet
Product Images NDC 63850-0059

View Photos of Packaging, Regulatory Labels, and Product Appearance

Product Visual Gallery

This gallery contains 26 technical images submitted to the FDA as part of the official labeling for Everolimus (NDC 63850-0059). Unlike standard consumer photos, these assets often include clinical data figures, molecular chemical structures, and official manufacturer packaging layouts.

As provided by Natco Pharma Limited, these visuals offer a comprehensive scientific overview of the product's physical and chemical identity, aiding pharmacists and researchers in product verification and study.

FDA Label Image

10mg Bottle Label

10mg Bottle Label
Everolimus Tablets 10 mg oral tablets in a 30-tablet package carton from Natco Pharma Limited. The label includes storage instructions, a barcode, the NDC 68500-061-4, and identification information including drug name, strength, and packaging details. The manufacturing location is Kothur, India.*
FDA Label Image

10mg Carton

10mg Carton
Everolimus Tablets 10 mg oral tablet packaging label by Natco Pharma Limited. The carton contains 28 tablets, divided into 4 blister cards of 7 tablets each. The label features the product name, strength (10 mg), manufacturer details, storage instructions, a barcode, and use warnings. The packaging dimensions are approximately 120 x 35 x 79 mm.*
FDA Label Image

10mg Foil

10mg Foil
Packaging label for Everolimus 10 mg oral tablets by Natco Pharma Limited. The label is designed as a repeated foil strip containing multiple individual panels, each showing product name, strength (10 mg), storage instructions, manufacturing details, and a barcode. Lot and expiration date fields are placeholders marked as 'XXXXXX' and 'MM/YYYY.' The label indicates storage at 25°C with permitted excursions and protection from light and moisture.*
FDA Label Image

2 5mg Foil

2 5mg Foil
Foil packaging label for Everolimus Tablet 2.5 mg, an oral prescription drug by Natco Pharma Limited. The label includes dosage strength, storage instructions, an NDC barcode (63850-0058-1), and mentions Rx only. The label layout shows multiple identical dosage unit labels in a repeated format for foil packaging.*
FDA Label Image

2 5mg Label

2 5mg Label
Everolimus Tablets 2.5 mg oral tablets, 30 count, labeled by Natco Pharma Limited. The packaging includes the NDC 63850-0584, storage instructions, and batch information areas. The label states prescription use only and contains safety storage advisory to keep out of reach of children.*
FDA Label Image

25mg Carton

25mg Carton
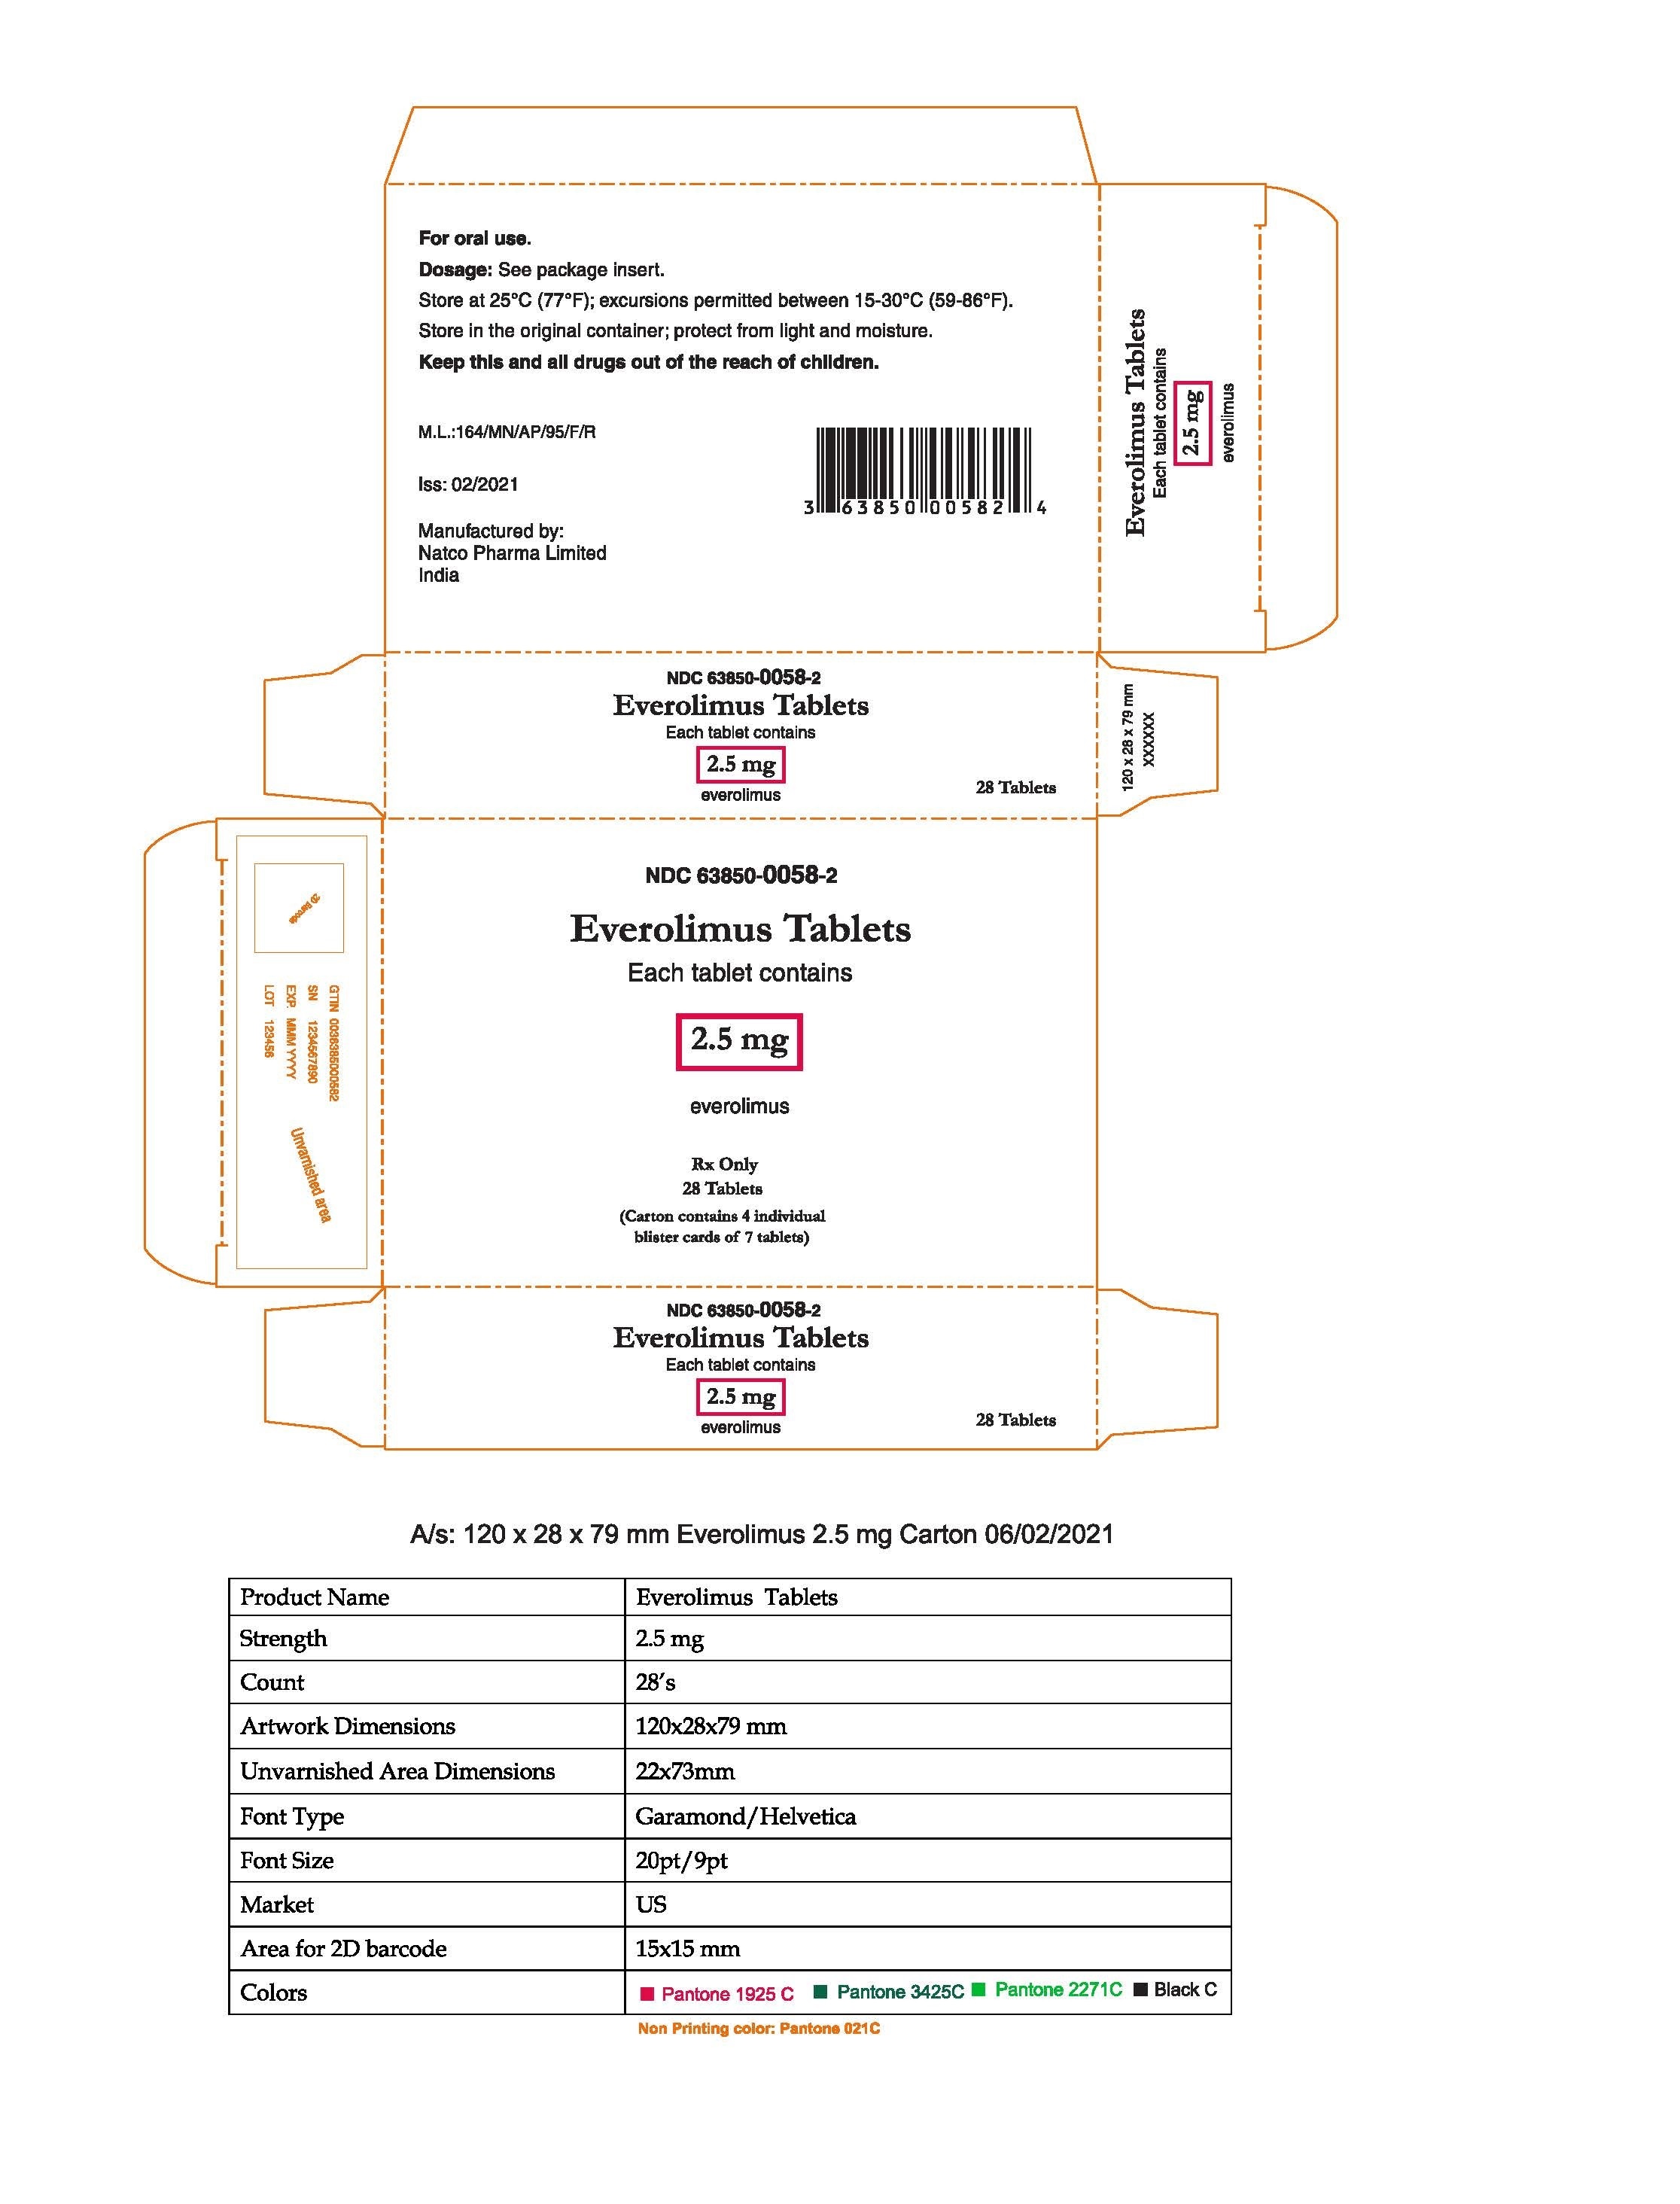
Packaging label for Everolimus Tablets 2.5 mg by Natco Pharma Limited. The carton contains 28 tablets for oral use. Label includes storage instructions, barcode, NDC 63850-0058-2, and dosing advice to see package insert. The design details dimensions and font types used for the label.*
FDA Label Image

5mg Bottle Label

5mg Bottle Label
Everolimus Tablets 5 mg oral tablets in a package containing 30 tablets. The label includes storage instructions, dosage guidance, manufacturer Natco Pharma Limited, and a barcode. It also shows placeholder text for batch number, serial number, expiration date, and lot number.*
FDA Label Image

5mg Carton

5mg Carton
Packaging label for Everolimus Tablets 5 mg by Natco Pharma Limited. The carton contains 28 tablets, divided into 4 blister cards with 7 tablets each. The label includes storage instructions, barcode, and manufacturer details. The label features the strength prominently in blue-highlighted boxes and specifies oral use only.*
FDA Label Image

5mg Foil

5mg Foil
Foil packaging label for Everolimus Tablet 5 mg by Natco Pharma Limited. The label includes storage instructions, barcode, NDC 63850-0059-1, Rx Only designation, and placeholders for lot number and expiration date. The foil measures 126 mm by 800 mm repeat length and features black and color 319C printing.*
FDA Label Image

7 5mg Bottle Label

7 5mg Bottle Label
Everolimus Tablets 7.5 mg oral tablets in a 30-tablet package by Natco Pharma Limited. The label includes dosage storage instructions, a barcode, and placeholders for NDC, serial number, expiration date, and lot number.*
FDA Label Image

7 5mg Foil

7 5mg Foil
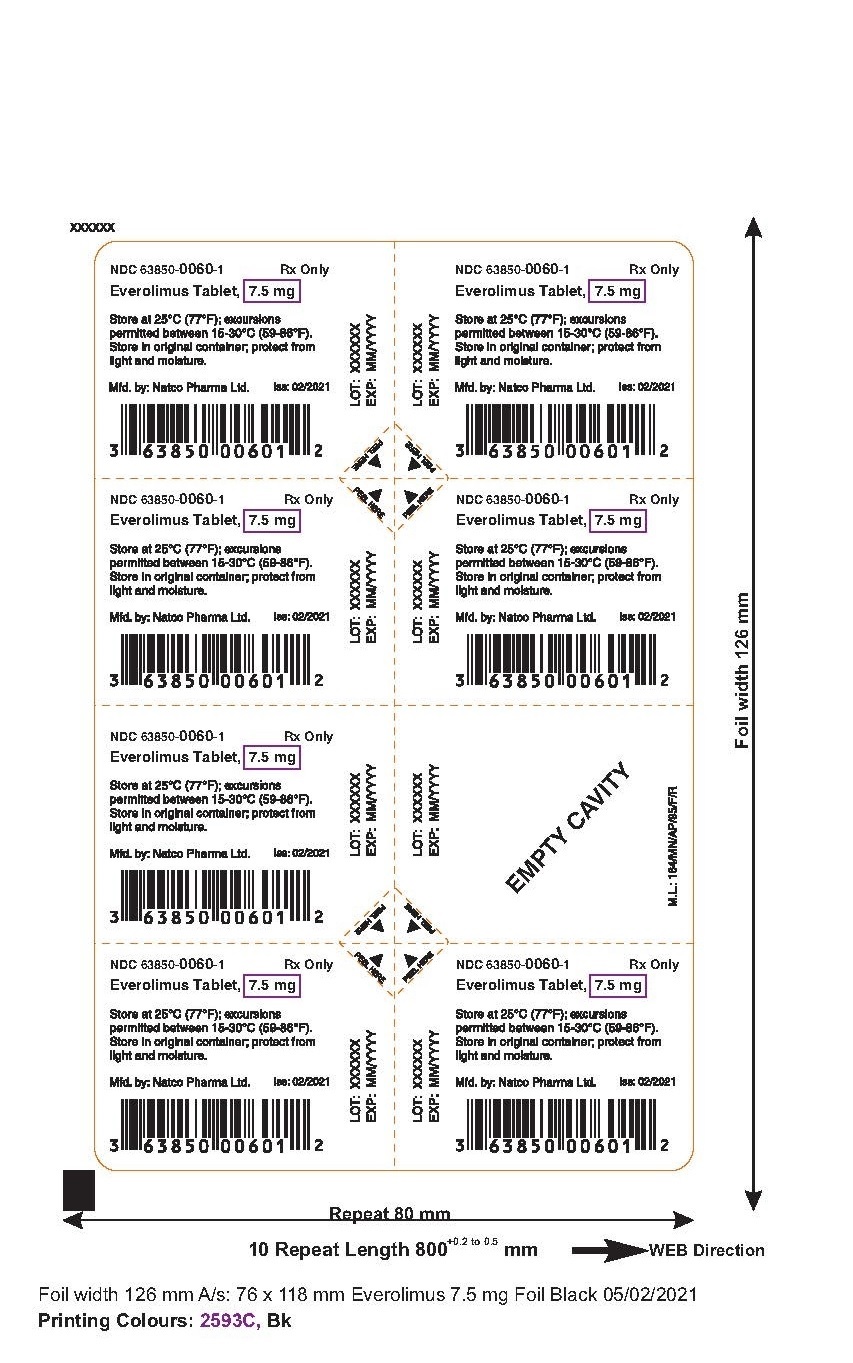
Packaging label for Everolimus Tablet, 7.5 mg, produced by Natco Pharma Limited. The label includes storage instructions to keep the product at 25°C (77°F) with excursions permitted between 15-30°C (59-86°F), and advises storing in the original container protected from light and moisture. The label also features the NDC number 63850-0060-1, a barcode, and placeholders for lot number and expiration date.*
FDA Label Image

Everolimus Study Graph (Everolimus Graph)

Everolimus Study Graph (Everolimus Graph)
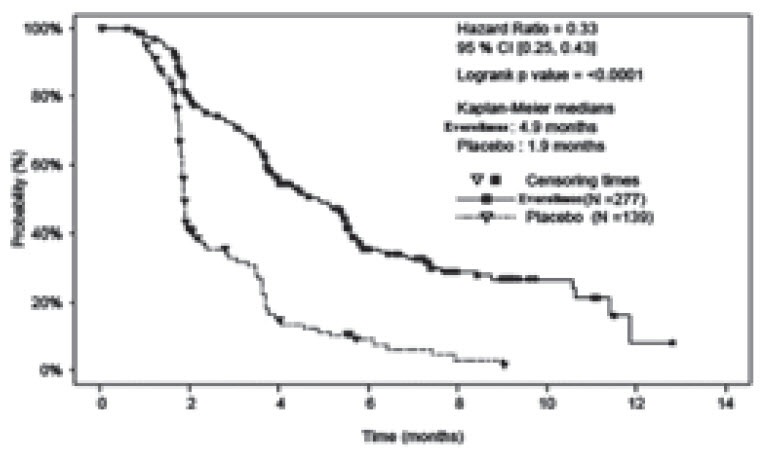
A Kaplan-Meier survival curve graph depicting probability (%) over time (months) comparing Everolimus and placebo groups. The graph includes hazard ratio, confidence interval, and statistical significance. It shows a survival comparison between Everolimus (N=277) and placebo (N=108) groups with median survival times indicated.*
FDA Label Image

Blister Opening Instruction (Everolimus Instru)

Blister Opening Instruction (Everolimus Instru)
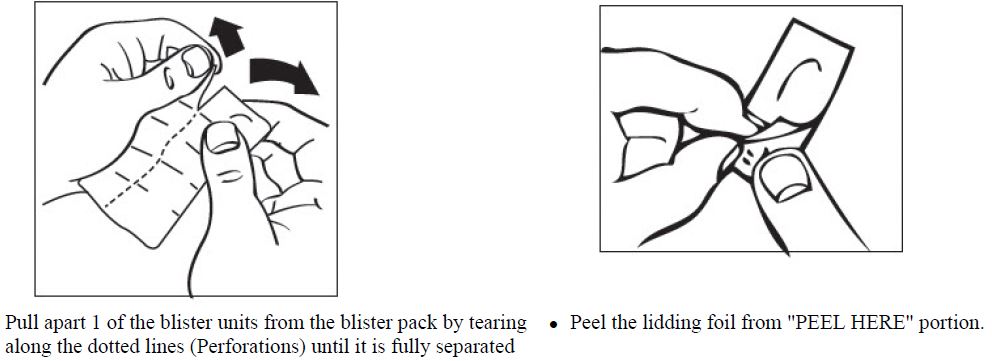
Instructional illustrations showing how to open Everolimus blister pack tablets. The first image depicts pulling apart a single blister unit along perforated dotted lines for separation. The second image shows peeling the lidding foil from the 'PEEL HERE' section to access the tablet inside.*
FDA Label Image

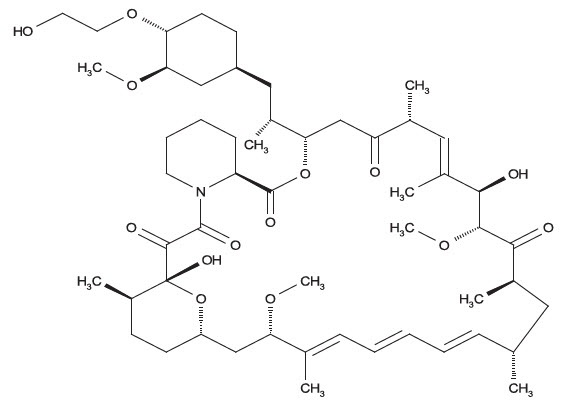
Everolimus Chemical Structure (Everolimus Structure)

Everolimus Chemical Structure (Everolimus Structure)
Chemical structure diagram of Everolimus showing its molecular arrangement with multiple rings, hydroxyl groups, and methyl groups. The sketch details the organic chemistry structure typical of this drug molecule.*
FDA Label Image

Figure 1

Figure 1
A Kaplan-Meier survival curve chart displaying progression-free survival probability over time in months. The chart compares two treatment groups: a 10 mg Everolimus plus exemestane group and a placebo plus exemestane group, illustrating differing survival probabilities and hazard ratios over approximately 28 months.*
FDA Label Image

Figure 2

Figure 2
A Kaplan-Meier survival curve comparing Everolimus and Placebo groups over time in months. The graph shows the probability percentage on the y-axis and time on the x-axis, indicating higher survival probability for the Everolimus group compared to Placebo. Censoring times are marked for each group, with statistical values including hazard ratio and confidence interval provided.*
FDA Label Image

Figure 3

Figure 3
A Kaplan-Meier survival curve comparing the probability of event-free survival over time (months) for two groups: Everolimus plus best supportive care (BSC) versus placebo plus BSC. The graph includes survival percentages on the y-axis and time in months on the x-axis with a table below showing the number of patients at risk at different time points for each group.*
FDA Label Image

Tabel 9

Tabel 9
A data table listing laboratory parameters comparing Everolimus tablets and placebo groups in a clinical setting. It shows percentages of patients experiencing various hematology and chemistry abnormalities for all grades and grades 3-4 severity. Parameters include anemia, lymphopenia, thrombocytopenia, leukopenia, neutropenia, hyperglycemia, increased alkaline phosphatase, and others, graded according to NCI CTCAE Version 3.0.*
FDA Label Image

Table 10

Table 10
Data table presenting adverse event incidences by grade for Everolimus Tablets (N=202) compared to placebo (N=98), categorized by system organ class such as gastrointestinal, general, infections, investigations, metabolism and nutrition, nervous system, respiratory, thoracic and mediastinal, and skin and subcutaneous events. Percentages for all grades and Grade 3-4 events are shown for each category.*
FDA Label Image

Table 11

Table 11
A data table comparing the incidence of various hematology and chemistry adverse events between patients taking Everolimus Tablets and placebo. It presents the percentage of all grades and grade 3-4 severity events for conditions such as anemia, lymphopenia, leukopenia, hypercholesterolemia, and hyperglycemia among others, with patient numbers indicated for each group.*
FDA Label Image

Table 20

Table 20
A table presenting comparative clinical data between Everolimus Tablets with Exemestane (N=485) and Placebo with Exemestane (N=239). It includes median progression-free survival in months assessed by investigator and independent radiological reviews, best overall response rates, hazard ratios, and p-values, with explanatory footnotes on statistical measures and criteria.*
FDA Label Image

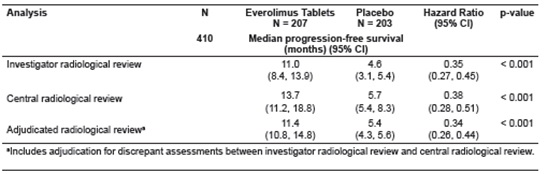
Table 21

Table 21
A data table comparing median progression-free survival in months between Everolimus tablets and placebo groups, with results from investigator radiological review, central radiological review, and adjudicated radiological review, including hazard ratios and p-values.*
FDA Label Image

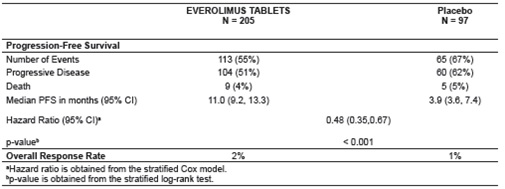
Table 22

Table 22
A data table comparing progression-free survival and overall response rate between Everolimus tablets (N=205) and placebo (N=97). It shows the number and percentage of events including progressive disease and death, median progression-free survival in months with 95% confidence intervals, hazard ratio with confidence intervals, and p-value. The overall response rate is also listed for both groups.*
FDA Label Image

Table 6

Table 6
A table comparing the incidence of various adverse reactions in patients treated with Everolimus Tablets with Exemestane versus Placebo with Exemestane. It lists the frequency percentages for all grades and grade 3-4 severity across categories such as gastrointestinal, general, infections, investigations, metabolism and nutrition, musculoskeletal, nervous system, psychiatric, respiratory, skin, and vascular reactions.*
FDA Label Image

Table 7

Table 7
A data table comparing laboratory parameter adverse event rates between Everolimus tablets with Exemestane (N=482) and placebo with Exemestane (N=238). It lists percentages for all grades and Grade 3-4 severity for hematology and chemistry parameters, including anemia, leukopenia, thrombocytopenia, lymphopenia, neutropenia, hypercholesterolemia, hyperglycemia, elevated AST and ALT, hypertriglyceridemia, hypoalbuminemia, hypokalemia, and increased creatinine.*
FDA Label Image

Table 8

Table 8
A data table comparing adverse event frequencies in Everolimus tablets (N=204) versus placebo (N=203) groups. The table lists percentages of various side effects across categories like gastrointestinal, general, infections, metabolism, musculoskeletal, nervous system, psychiatric, respiratory, skin, and vascular. Data shows overall and Grade 3-4 severity percentages for both groups.*

* About these descriptions: Image descriptions on this page are generated by automated AI analysis of the product label images from the manufacturer's FDA label submission (SPL). They are provided for reference only and may contain errors or omissions. Always rely on the printed label itself and the official FDA labeling, and consult a pharmacist or healthcare professional with any questions about this product.