Everolimus
Product Images NDC 63850-0128

View Photos of Packaging, Regulatory Labels, and Product Appearance

Product Visual Gallery

This gallery contains 38 technical images submitted to the FDA as part of the official labeling for Everolimus (NDC 63850-0128). Unlike standard consumer photos, these assets often include clinical data figures, molecular chemical structures, and official manufacturer packaging layouts.

As provided by Natco Pharma Limited, these visuals offer a comprehensive scientific overview of the product's physical and chemical identity, aiding pharmacists and researchers in product verification and study.

FDA Label Image

Carton-1 (Everolimus 2mg Carton)

Carton-1 (Everolimus 2mg Carton)
Packaging label for Everolimus Tablets for Oral Suspension, 2 mg per tablet, manufactured by Natco Pharma Limited. The carton contains 28 tablets divided into blister cards. Instructions indicate tablets must be dispersed in water and not swallowed whole, chewed, or crushed. Storage conditions and usage warnings are also noted.*
FDA Label Image

Foil-1 (Everolimus 2mg Foil)

Foil-1 (Everolimus 2mg Foil)
Everolimus Tablet for Oral Suspension 2 mg labels from Natco Pharma Limited. Each label includes dosage strength, storage instructions to keep between 20°C to 25°C (68°F to 77°F) with permitted excursions, and manufacturer details including location in Visakhapatnam, India. The labels bear the NDC 63850-0128-1 and specify 'Rx Only.' There are multiple identical labels arranged on the sheet with barcode and lot number placeholders.*
FDA Label Image

Carton-2 (Everolimus 3mg Carton)

Carton-2 (Everolimus 3mg Carton)
Packaging label for Everolimus Tablets for Oral Suspension, each tablet containing 3 mg of everolimus. The label states the product is for oral use only and includes storage instructions to keep between 20°C to 25°C, protected from light and moisture. The labeler is Natco Pharma Limited, Visakhapatnam, India. The carton contains 28 tablets packaged as 4 blister cards with 7 tablets each.*
FDA Label Image

Foil-1 (Everolimus 3mg Foil)

Foil-1 (Everolimus 3mg Foil)
Everolimus Tablet for Oral Suspension 3 mg label by Natco Pharma Limited. The label includes storage instructions to keep between 20°C to 25°C with exceptions allowed between 15°C and 30°C. It also states to store in the original container, protect from light and moisture, and displays the NDC 63850-0129-1. The label is presented multiple times on a perforated sheet with scissor cut marks and an 'EMPTY CAVITY' section.*
FDA Label Image

Carton-3 (Everolimus 5mg Carton)

Carton-3 (Everolimus 5mg Carton)
Everolimus Tablets for Oral Suspension 5 mg per tablet carton label from Natco Pharma Limited. The packaging indicates 28 tablets for oral suspension, with instructions to disperse tablets in water and not to swallow them whole, chewed, or crushed. The label includes storage directions, manufacturer information, and an NDC of 63850-0130-2.*
FDA Label Image

Carton-5 (Everolimus 5mg Foil)

Carton-5 (Everolimus 5mg Foil)
Everolimus Tablet for Oral Suspension 5 mg label from Natco Pharma Limited. The label includes storage instructions to keep between 20°C to 25°C (68°F to 77°F), with permitted excursions between 15°C and 30°C. It states to store in original container and protect from light and moisture. The label also shows NDC 63850-0130-1, batch numbers, barcodes, and an empty cavity cutout in the center.*
FDA Label Image

Figure-1 (Everolimus Figure 1)

Figure-1 (Everolimus Figure 1)
A Kaplan-Meier survival curve chart showing progression-free survival probability (%) over time in months. The chart compares Everolimus 10 mg plus exemestane versus placebo plus exemestane, with censoring times indicated. The chart includes hazard ratio, confidence interval, median survival times, and a statistical significance p-value.*
FDA Label Image

Figure-2 (Everolimus Figure 2)

Figure-2 (Everolimus Figure 2)
A Kaplan-Meier survival curve comparing Everolimus (N=207) and placebo (N=203) over time in months. The graph shows probability percentage on the y-axis and time in months on the x-axis, with Everolimus represented by a solid line and placebo by a dashed line. Censoring times are indicated by specific markers. Hazard ratio, confidence intervals, and logrank p-value are noted in the upper right.*
FDA Label Image

Figure-4 (Everolimus Figure 4)

Figure-4 (Everolimus Figure 4)
A Kaplan-Meier survival curve graph showing probability (%) over time in months comparing Everolimus and placebo groups. The graph includes hazard ratio, confidence interval, and logrank p value, illustrating survival differences between Everolimus and placebo treatment in a censored survival analysis.*
FDA Label Image

Image-1 (Everolimus Image 1)

Image-1 (Everolimus Image 1)
An instructional illustration depicting hands tearing open a foil blister pack, demonstrating how to access medication tablets. The image shows one hand holding the blister pack while the other hand pulls back the foil.*
FDA Label Image

Image-2 (Everolimus Image 2)

Image-2 (Everolimus Image 2)
An instructional illustration showing hands squeezing a tube to dispense its contents. The image depicts how to administer or use the product from the tube, presumably Everolimus by Natco Pharma Limited.*
FDA Label Image

Image-3 (Everolimus Image 3)

Image-3 (Everolimus Image 3)
An illustration showing hands using scissors to cut a medication blister pack into smaller sections. The image highlights a method for dividing blister packs, possibly for dose management or storage.*
FDA Label Image

Table-1 (Everolimus Table 1)

Table-1 (Everolimus Table 1)
A table listing events and the recommended timing for assessing trough concentrations after each event for Everolimus treatment. Events include initiation, dose modification, switching dosage forms, changes in drug interactions, hepatic function changes, and dosing adjustments based on body surface area (BSA). The timing ranges from 1-2 weeks to every 6 to 12 months depending on the event.*
FDA Label Image

Table-10 (Everolimus Table 10)

Table-10 (Everolimus Table 10)
Table comparing the incidence of various adverse reactions between Everolimus tablets (N=202) and Placebo (N=98), showing percentages for all grades and Grades 3-4 in categories including gastrointestinal, general, infections, investigations, metabolism and nutrition, nervous system, respiratory, thoracic and mediastinal, and skin and subcutaneous.*
FDA Label Image

Table-11 (Everolimus Table 11)

Table-11 (Everolimus Table 11)
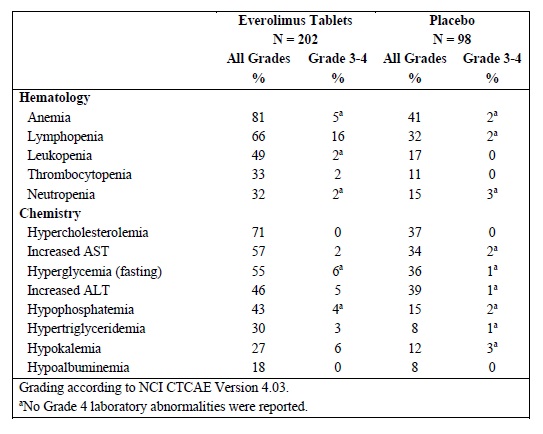
A comparative data table showing percentages of hematology and chemistry laboratory abnormalities for Everolimus Tablets versus placebo groups, including all grades and grade 3-4 severities, with data based on NCI CTCAE Version 4.03 grading.*
FDA Label Image

Table-12 (Everolimus Table 12)

Table-12 (Everolimus Table 12)
A data table comparing adverse event rates between Everolimus Tablets (N=274) and placebo (N=137). It lists percentages of various side effects across categories such as gastrointestinal, infections, general symptoms, respiratory, skin, metabolism, nervous system, and musculoskeletal tissue. It also includes grade 3-4 severity columns and footnotes clarifying grading criteria and specific definitions for terms like stomatitis and infections.*
FDA Label Image

Table-13 (Everolimus Table 13)

Table-13 (Everolimus Table 13)
A data table comparing laboratory parameters between Everolimus tablets and placebo groups, including percentages of hematology and chemistry abnormalities graded by severity (All Grades and Grade 3-4) for anemia, lymphopenia, thrombocytopenia, neutropenia, hypercholesterolemia, hypertriglyceridemia, hyperglycemia, increased creatinine, hypophosphatemia, increased AST, ALT, and hyperbilirubinemia. Notes indicate grading criteria and frequency of adverse drug reactions.*
FDA Label Image

Table-14 (Everolimus Table 14)

Table-14 (Everolimus Table 14)
A data table comparing adverse event percentages between Everolimus Tablets and Placebo groups. It lists various categories such as gastrointestinal, general, infections, musculoskeletal, respiratory, and skin-related events, showing incidence rates for all grades and for grades 3-4 based on NCI CTCAE Version 3.0 criteria.*
FDA Label Image

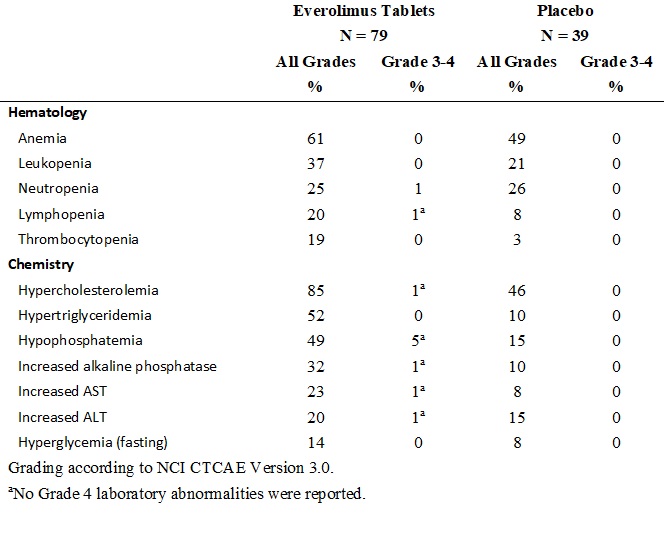
Table-15 (Everolimus Table 15)

Table-15 (Everolimus Table 15)
A data table comparing hematology and chemistry adverse event rates for Everolimus tablets (N=79) versus placebo (N=39). It shows percentages for all grades and Grade 3-4 abnormalities across conditions such as anemia, leukopenia, neutropenia, hypercholesterolemia, and others. Grade 4 laboratory abnormalities were not reported. The grading is based on NCI CTCAE Version 3.0.*
FDA Label Image

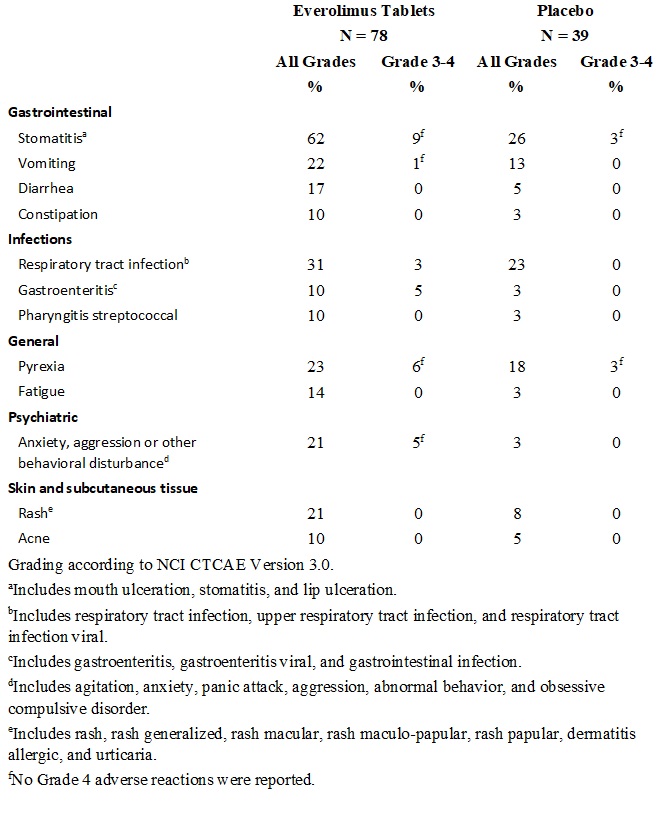
Table-16 (Everolimus Table 16)

Table-16 (Everolimus Table 16)
Table comparing the incidence of adverse effects between Everolimus Tablets (N=78) and Placebo (N=39), categorized by severity grades and system organ class, including gastrointestinal, infections, general, psychiatric, and skin/subcutaneous tissue events, with footnotes explaining grading criteria and specific condition inclusions.*
FDA Label Image

Table-17 (Everolimus Table 17)

Table-17 (Everolimus Table 17)
A data table comparing laboratory abnormalities between Everolimus Tablets and placebo groups, showing percentages for all grades and grades 3-4. It covers hematology and chemistry abnormalities such as elevated partial thromboplastin time, neutropenia, anemia, hypercholesterolemia, elevated AST and ALT, hypertriglyceridemia, and hypophosphatemia, graded according to NCI CTCAE Version 3.0.*
FDA Label Image

Table-2 (Everolimus Table 2 2part)

Table-2 (Everolimus Table 2 2part)
Table summarizing dosage adjustment guidelines for Everolimus related to neutropenia and febrile neutropenia. It specifies actions for Grade 3 and Grade 4 neutropenia, including withholding dosage until improvement and resuming at adjusted doses, and permanent discontinuation in some cases.*
FDA Label Image

Table-2 (Everolimus Table 2)

Table-2 (Everolimus Table 2)
A data table listing adverse reactions for Everolimus by Natco Pharma Limited, detailing severity grades and corresponding dosage modification instructions. Reactions include non-infectious pneumonitis, stomatitis, metabolic events (like hyperglycemia and dyslipidemia), non-hematologic toxicities, and thrombocytopenia with specific dosage adjustments for Grades 2, 3, and 4 severity.*
FDA Label Image

Table-20 (Everolimus Table 20)

Table-20 (Everolimus Table 20)
A data table comparing clinical outcomes between Everolimus tablets with Exemestane and placebo with Exemestane for 485 and 239 patients respectively. It presents median progression-free survival in months from radiological reviews, hazard ratios, p-values, and objective response rates with 95% confidence intervals.*
FDA Label Image

Table-21 (Everolimus Table 21)

Table-21 (Everolimus Table 21)
A data table comparing median progression-free survival (months) with 95% confidence intervals for Everolimus Tablets (N=207) and Placebo (N=203) across three types of radiological review: Investigator radiological review, Central radiological review, and Adjudicated radiological review. The table also shows hazard ratios with 95% confidence intervals and p-values for each comparison. A footnote explains adjudication includes assessments for discrepancies between investigator and central reviews.*
FDA Label Image

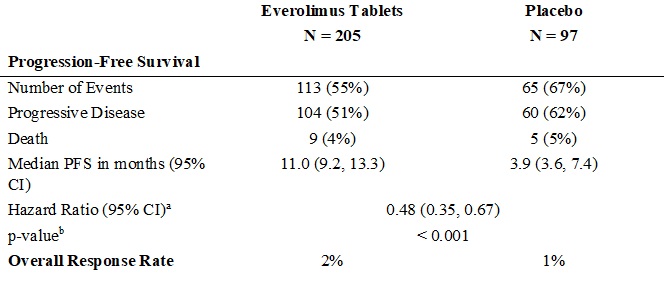
Table-22 (Everolimus Table 22)

Table-22 (Everolimus Table 22)
A data table comparing progression-free survival and overall response rate between Everolimus tablets and placebo groups. The table includes number of events, progressive disease, death, median progression-free survival in months with confidence interval, hazard ratio with confidence interval, p-value, and overall response rate percentages for each group.*
FDA Label Image

Table (Everolimus Table 23)

Table (Everolimus Table 23)
A data table comparing Everolimus tablets (N=277) with placebo (N=139) showing median progression-free survival, objective response rate, hazard ratio, and p-values. It presents statistical outcomes including median progression-free survival in months and objective response rate percentages.*
FDA Label Image

Table-24 (Everolimus Table 24)

Table-24 (Everolimus Table 24)
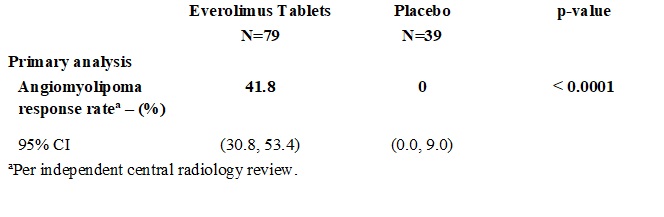
A data table comparing angiomyolipoma response rates between Everolimus tablets (N=79) and placebo (N=39). The table presents response rates, 95% confidence intervals, and p-values from an independent central radiology review, showing a significant difference favoring Everolimus.*
FDA Label Image

Table-25 (Everolimus Table 25)

Table-25 (Everolimus Table 25)
A data table comparing the SEGA response rate between Everolimus Tablets and Placebo groups. It includes sample sizes (N=78 for Everolimus, N=39 for Placebo), response counts (35 for Everolimus, 0 for Placebo), percentages, 95% confidence intervals, and a p-value less than 0.0001 for statistical significance. The table notes that the analysis is based on an independent central radiology review.*
FDA Label Image

Table-3 (Everolimus Table 3)

Table-3 (Everolimus Table 3)
Table titled 'Dose Modification for Everolimus Tablets/Everolimus Tablets for Oral Suspension' showing dose adjustments for Everolimus based on hepatic impairment levels (Child-Pugh classes A, B, C) for indications including Breast Cancer, NET, RCC, TSC-Associated Renal Angiomyolipoma, and TSC-Associated SEGA. It includes specific dosing recommendations and definitions of abbreviations like NET, RCC, SEGA, and TSC.*
FDA Label Image

Table-4 (Everolimus Table 4)

Table-4 (Everolimus Table 4)
Text panel titled 'Dose Modification for Everolimus Tablets/Everolimus Tablets for Oral Suspension' listing dosing adjustments for indications including breast cancer, NET, RCC, TSC-Associated Renal Angiomyolipoma, and TSC-Associated SEGA. It details dose reduction, increments, and resumption guidance related to inhibitor use.*
FDA Label Image

Table-5 (Everolimus Table 5)

Table-5 (Everolimus Table 5)
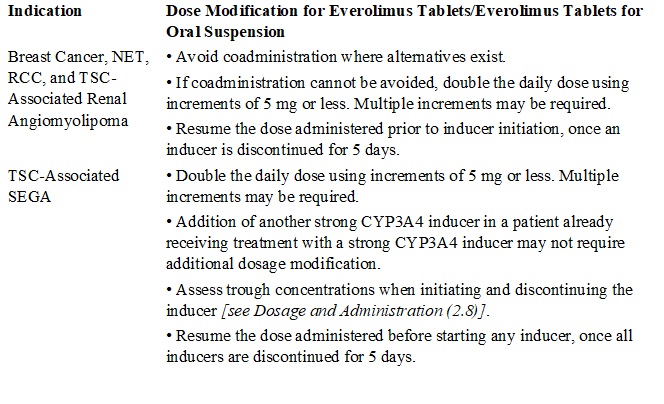
Text panel titled 'Dose Modification for Everolimus Tablets/Everolimus Tablets for Oral Suspension' outlining management recommendations for various indications including Breast Cancer, NET, RCC, TSC-Associated Renal Angiomyolipoma, and TSC-Associated SEGA. It includes guidelines for dose adjustments when coadministered with CYP3A4 inducers.*
FDA Label Image

Table-6 (Everolimus Table 6 2part)

Table-6 (Everolimus Table 6 2part)
Table presenting adverse reaction grades by system organ class for Everolimus, including nervous system, psychiatric, respiratory, thoracic and mediastinal, skin and subcutaneous tissue, and vascular events. It includes specific conditions like dysgeusia, headache, insomnia, cough, dyspnea, rash, and hot flush, with numeric grading and footnotes explaining grading criteria.*
FDA Label Image

Table-6 (Everolimus Table 6)

Table-6 (Everolimus Table 6)
A data table comparing the incidence of adverse events between Everolimus tablets with Exemestane (N=482) and Placebo with Exemestane (N=238). The table categorizes events by system (e.g., gastrointestinal, general, infections) and reports percentages for all grades and grades 3-4. It includes conditions such as stomatitis, diarrhea, fatigue, infections, weight loss, and musculoskeletal pain.*
FDA Label Image

Table-7 (Everolimus Table 7)

Table-7 (Everolimus Table 7)
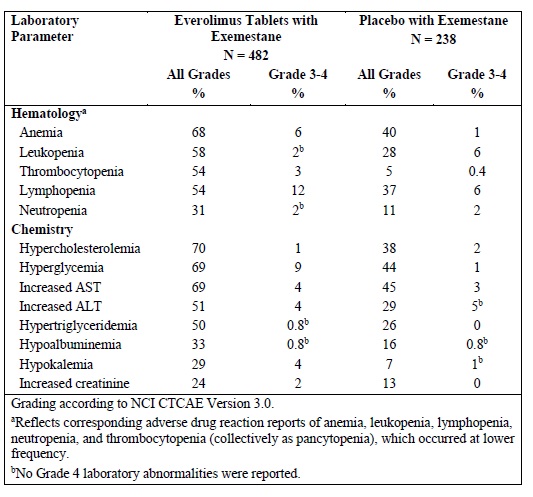
A comparative laboratory parameter data table showing percentages of hematology and chemistry abnormalities for Everolimus Tablets with Exemestane (N=482) versus Placebo with Exemestane (N=238). The table lists all grades and Grade 3-4 occurrences for anemia, leukopenia, thrombocytopenia, lymphopenia, neutropenia, hypercholesterolemia, hyperglycemia, increased AST, increased ALT, hypertriglyceridemia, hypoalbuminemia, hypokalemia, and increased creatinine.*
FDA Label Image

Table-8 (Everolimus Table 8 2part)

Table-8 (Everolimus Table 8 2part)
A data table summarizing adverse reactions graded according to NCI CTCAE Version 3.0, listing various symptoms such as dyspnea, pneumonitis, oropharyngeal pain, skin and subcutaneous disorders, vascular conditions, and corresponding frequencies across different severity grades. Footnotes clarify inclusions for certain terms and note that no Grade 4 adverse reactions were reported.*
FDA Label Image

Table-8 (Everolimus Table 8)

Table-8 (Everolimus Table 8)
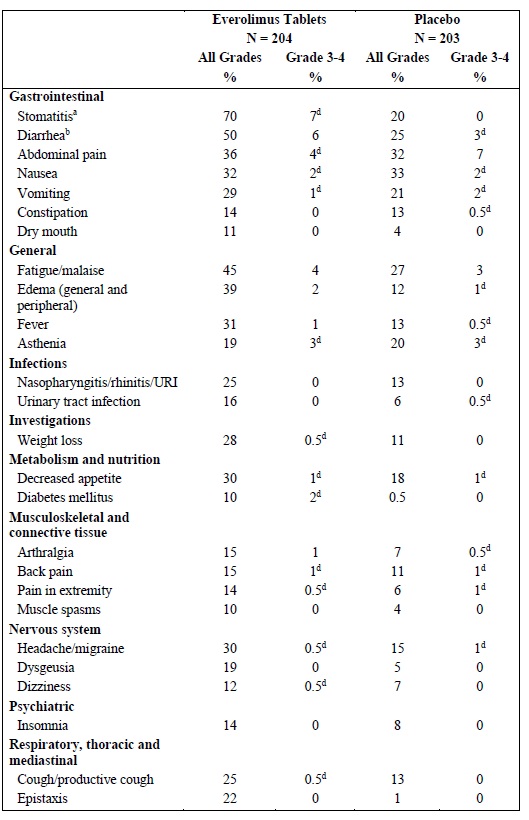
A data table comparing the incidence and severity of adverse events between patients taking Everolimus tablets (N=204) and placebo (N=203). The table categorizes events into systems such as gastrointestinal, general, infections, metabolism, musculoskeletal, nervous system, psychiatric, and respiratory. Both all grades and grade 3-4 percentages are presented for each group.*
FDA Label Image

Table-9 (Everolimus Table 9)

Table-9 (Everolimus Table 9)
A data table comparing laboratory parameters between Everolimus tablets (N=204) and placebo (N=203). It shows percentages for various hematology and chemistry adverse events occurring at all grades and grades 3-4, including anemia, lymphopenia, hyperglycemia, increased liver enzymes, and electrolyte abnormalities, graded according to NCI CTCAE Version 3.0.*

* About these descriptions: Image descriptions on this page are generated by automated AI analysis of the product label images from the manufacturer's FDA label submission (SPL). They are provided for reference only and may contain errors or omissions. Always rely on the printed label itself and the official FDA labeling, and consult a pharmacist or healthcare professional with any questions about this product.