Donepezil Hydrochloride
Product Images NDC 64239-404

View Photos of Packaging, Regulatory Labels, and Product Appearance

Product Visual Gallery

This gallery contains 17 technical images submitted to the FDA as part of the official labeling for Donepezil Hydrochloride (NDC 64239-404). Unlike standard consumer photos, these assets often include clinical data figures, molecular chemical structures, and official manufacturer packaging layouts.

As provided by Dexcel Pharma Technologies Ltd., these visuals offer a comprehensive scientific overview of the product's physical and chemical identity, aiding pharmacists and researchers in product verification and study.

FDA Label Image

100 Tablets (100 Tablets)
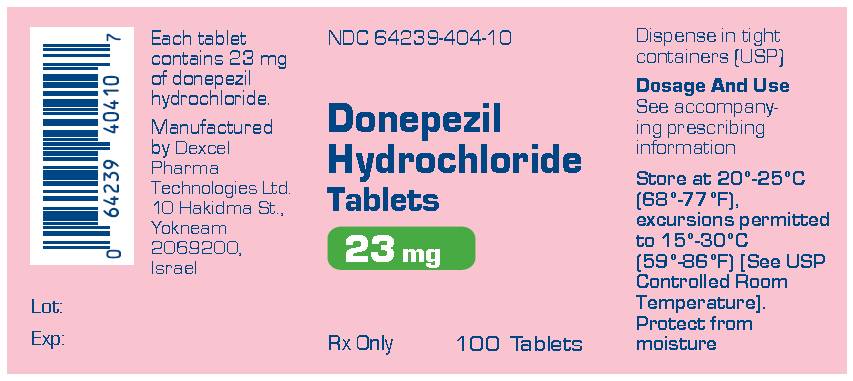
100 Tablets (100 Tablets)
Donepezil Hydrochloride Tablets 23 mg label showing the active ingredient strength and dosage form. The label includes the National Drug Code (NDC) 64239-404-10 and states the product is manufactured by Dexcel Pharma Technologies Ltd. It indicates a quantity of 100 tablets and provides storage instructions, including temperature ranges and moisture protection. The label also notes the product is Rx only.*
FDA Label Image

30 Tablets (30 Tablets)

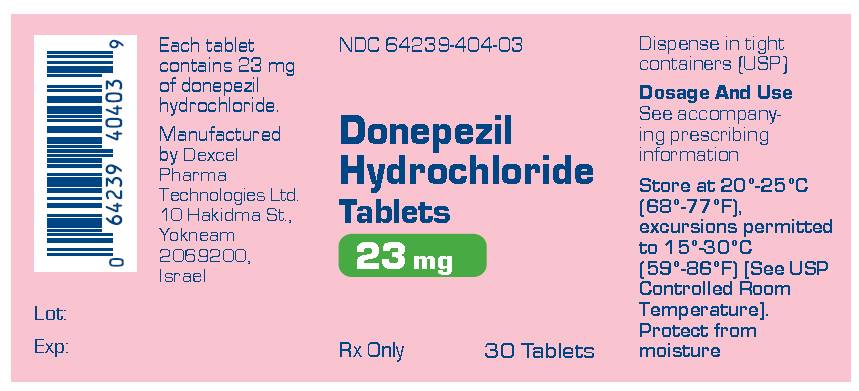
30 Tablets (30 Tablets)
Donepezil Hydrochloride 23 mg tablets label from Dexcel Pharma Technologies Ltd. The label includes the active ingredient strength, 23 mg, NDC 64239-404-03, and states the package contains 30 tablets. It provides storage instructions and notes the product is Rx only.*
FDA Label Image

500 Tablets (500 Tablets)

500 Tablets (500 Tablets)
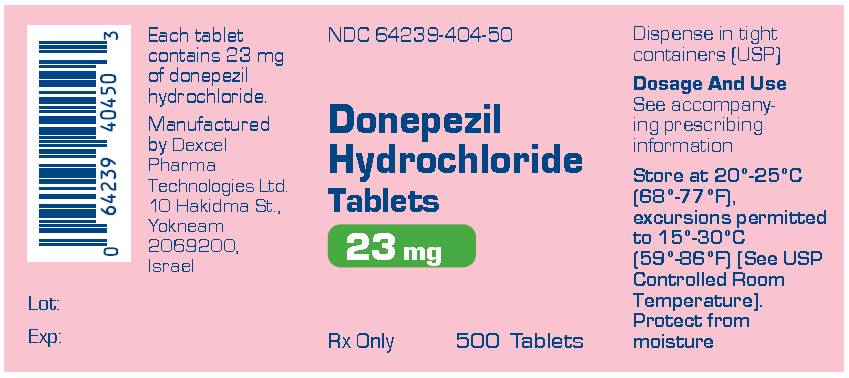
Label for Donepezil Hydrochloride Tablets, 23 mg strength, manufactured by Dexcel Pharma Technologies Ltd. The label states the product contains 23 mg of donepezil hydrochloride per tablet, with a package count of 500 tablets. It includes storage instructions to keep at 20°-25°C with allowed excursions and protection from moisture, and notes the product is Rx Only.*
FDA Label Image

Structural Formula (Don01 0003 01)

Structural Formula (Don01 0003 01)
Chemical structure diagram of Donepezil Hydrochloride, showing its molecular components and connectivity as represented in line and ring notation including functional groups such as methoxy and piperidine rings.*
FDA Label Image

Figure 1 (Don01 0003 02)

Figure 1 (Don01 0003 02)
A line chart depicting the change from baseline in ADAS-cog scores over weeks of drug treatment for Donepezil Hydrochloride at doses of 10 mg/day and 5 mg/day compared to placebo. The x-axis shows weeks of drug treatment up to 30, and the y-axis measures ADAS-cog change from baseline, with directions for clinical improvement and decline indicated.*
FDA Label Image

Figure 2 (Don01 0003 03)

Figure 2 (Don01 0003 03)
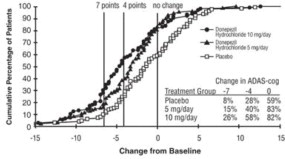
A line graph showing the cumulative percentage of patients versus change from baseline in ADAS-cog scores for Donepezil Hydrochloride 5 mg/day, 10 mg/day, and placebo treatment groups. The graph includes annotations indicating specific changes such as 7 points improvement, 4 points improvement, and no change, comparing the cognitive score changes among the three groups.*
FDA Label Image

Figure 3 (Don01 0003 04)

Figure 3 (Don01 0003 04)
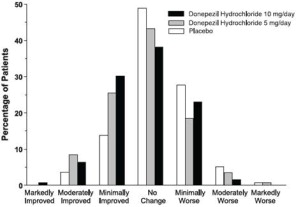
A bar chart depicting the percentage of patients experiencing various levels of change after treatment with Donepezil Hydrochloride 10 mg/day, 5 mg/day, or placebo. The categories range from markedly improved to markedly worse, with 'No Change' showing the highest percentages across groups.*
FDA Label Image

Figure 4 (Don01 0003 05)

Figure 4 (Don01 0003 05)
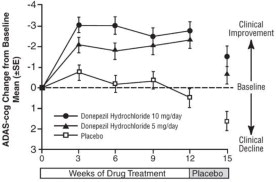
A line graph illustrating the change in ADAS-Cog score from baseline over a 12-week drug treatment period followed by a placebo phase. The graph compares Donepezil Hydrochloride 10 mg/day, 5 mg/day, and placebo groups, showing mean changes with error bars to indicate variability. Clinical improvement and decline are marked relative to baseline.*
FDA Label Image

Figure 5 (Don01 0003 06)

Figure 5 (Don01 0003 06)
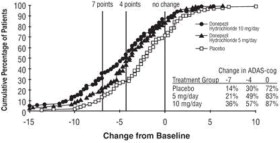
A line chart showing the cumulative percentage of patients on the y-axis against change from baseline on the x-axis, comparing Donepezil Hydrochloride 10 mg/day and 5 mg/day doses with placebo. The chart includes a legend and a table summarizing percentage improvement in ADAS-cog scores by treatment group.*
FDA Label Image

Figure 6 (Don01 0003 07)

Figure 6 (Don01 0003 07)
Bar chart comparing percentages of patients by improvement level for Donepezil Hydrochloride 10 mg/day, 5 mg/day, and placebo. The categories include Markedly Improved, Moderately Improved, Minimally Improved, No Change, Minimally Worse, Moderately Worse, and Markedly Worse.*
FDA Label Image

Figure 7 (Don01 0003 08)

Figure 7 (Don01 0003 08)
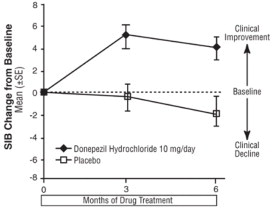
A line graph depicting clinical response to Donepezil Hydrochloride 10 mg/day compared to placebo over 6 months. The vertical axis shows SIB change from baseline (mean ± SE), with positive values indicating clinical improvement and negative values clinical decline. The horizontal axis marks months of drug treatment at 0, 3, and 6 months.*
FDA Label Image

Figure 8 (Don01 0003 09)

Figure 8 (Don01 0003 09)
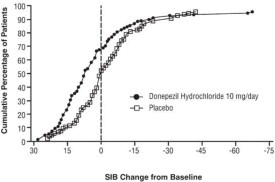
A cumulative percentage of patients graph comparing Donepezil Hydrochloride 10 mg/day to placebo. The x-axis represents SIB (Severe Impairment Battery) change from baseline, while the y-axis shows cumulative percentage of patients. The graph plots two curves: one for Donepezil Hydrochloride 10 mg/day (circles) and one for placebo (squares), demonstrating differences in patient response over time.*
FDA Label Image

Figure 9 (Don01 0003 10)

Figure 9 (Don01 0003 10)
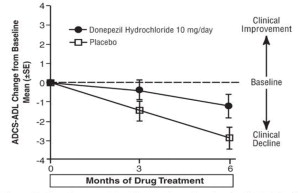
A line graph illustrating the ADCS-ADL change from baseline (mean ± SEM) over six months of drug treatment comparing Donepezil Hydrochloride 10 mg/day with placebo. The vertical axis shows clinical improvement to decline, and the horizontal axis shows months of treatment, demonstrating differences in clinical outcomes between the two groups.*
FDA Label Image

Figure 10 (Don01 0003 11)

Figure 10 (Don01 0003 11)
A cumulative percentage graph comparing Donepezil Hydrochloride 10 mg/day and placebo groups, showing ADCS-ADL change from baseline over time. The x-axis represents change from baseline, and the y-axis represents the cumulative percentage of patients.*
FDA Label Image

Figure 11 (Don01 0003 12)

Figure 11 (Don01 0003 12)
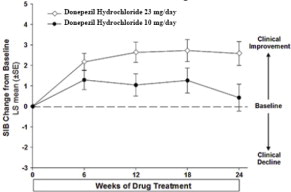
A line graph showing the change from baseline in SIB (Severe Impairment Battery) scores over 24 weeks of treatment with Donepezil Hydrochloride at 10 mg/day and 23 mg/day doses. The vertical axis represents the change in SIB score ranging from -3 to 5, indicating clinical decline to improvement, and the horizontal axis shows weeks of drug treatment at 0, 6, 12, 18, and 24 weeks. The 23 mg/day dose demonstrates a greater increase in SIB scores compared to the 10 mg/day dose over time.*
FDA Label Image

Figure 12 (Don01 0003 13)

Figure 12 (Don01 0003 13)
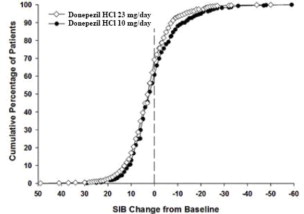
A cumulative percentage of patients graph comparing Donepezil Hydrochloride 23 mg/day and 10 mg/day doses. The x-axis represents the SIB (Severe Impairment Battery) change from baseline, ranging approximately from -60 to 50, while the y-axis shows the cumulative percentage of patients from 0% to 100%. Two curves are plotted, indicating the response distribution for each dosage.*
FDA Label Image

Figure 13 (Don01 0003 14)

Figure 13 (Don01 0003 14)
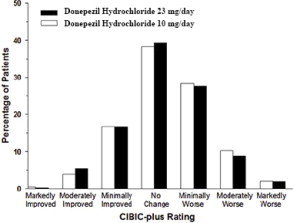
A bar chart comparing patient response percentages for Donepezil Hydrochloride at 23 mg/day and 10 mg/day doses across categories of clinical improvement or worsening based on the CIBIC-plus scale, from markedly improved to markedly worse.*

* About these descriptions: Image descriptions on this page are generated by automated AI analysis of the product label images from the manufacturer's FDA label submission (SPL). They are provided for reference only and may contain errors or omissions. Always rely on the printed label itself and the official FDA labeling, and consult a pharmacist or healthcare professional with any questions about this product.