Dutasteride Capsule, Liquid Filled
Product Images NDC 64380-763

View Photos of Packaging, Regulatory Labels, and Product Appearance

Product Visual Gallery

This gallery contains 10 technical images submitted to the FDA as part of the official labeling for Dutasteride (NDC 64380-763). Unlike standard consumer photos, these assets often include clinical data figures, molecular chemical structures, and official manufacturer packaging layouts.

As provided by Strides Pharma Science Limited, these visuals offer a comprehensive scientific overview of the product's physical and chemical identity, aiding pharmacists and researchers in product verification and study.

FDA Label Image

44b80a39 9206 4f6f 82c5 12bb8ef0530e 01
44b80a39 9206 4f6f 82c5 12bb8ef0530e 01
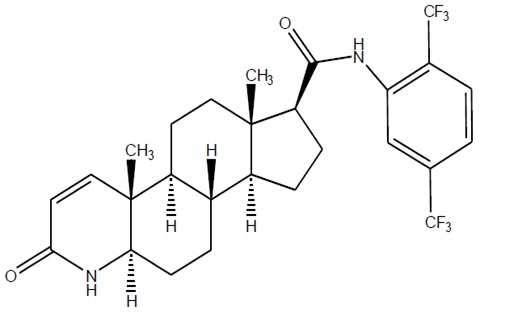
Chemical structure of Dutasteride, a human prescription drug with the generic name Dutasteride. The structure shows a steroid backbone with multiple rings and attached functional groups, including a trifluoromethyl-substituted phenyl group.*
FDA Label Image

44b80a39 9206 4f6f 82c5 12bb8ef0530e 02

44b80a39 9206 4f6f 82c5 12bb8ef0530e 02
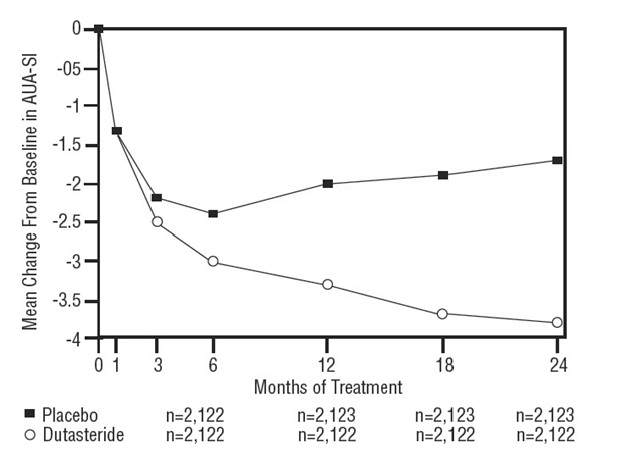
A line graph showing mean change from baseline in AUA-SI score over 24 months of treatment, comparing Dutasteride and Placebo groups. The x-axis represents months of treatment (0 to 24), and the y-axis shows mean change from baseline. Dutasteride group shows a greater decrease over time compared to Placebo.*
FDA Label Image

44b80a39 9206 4f6f 82c5 12bb8ef0530e 03

44b80a39 9206 4f6f 82c5 12bb8ef0530e 03
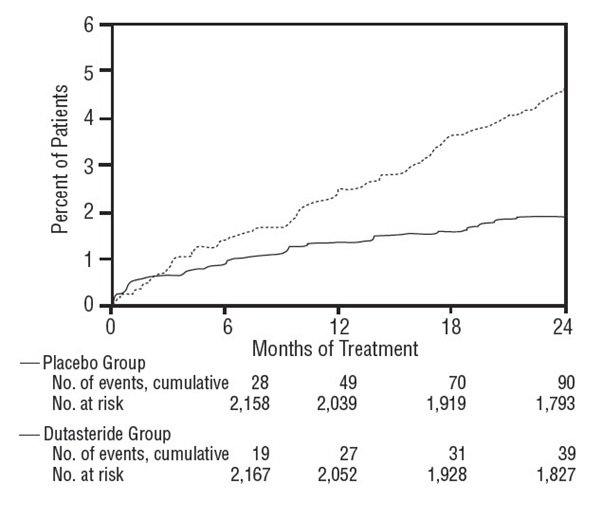
A line chart showing the cumulative percentage of patients over 24 months of treatment, comparing a placebo group and a dutasteride group. The x-axis represents months of treatment (0 to 24), and the y-axis shows percent of patients (0 to 6%). The chart includes cumulative event counts and number at risk for each group at 0, 6, 12, 18, and 24 months, indicating fewer events in the dutasteride group.*
FDA Label Image

44b80a39 9206 4f6f 82c5 12bb8ef0530e 04

44b80a39 9206 4f6f 82c5 12bb8ef0530e 04
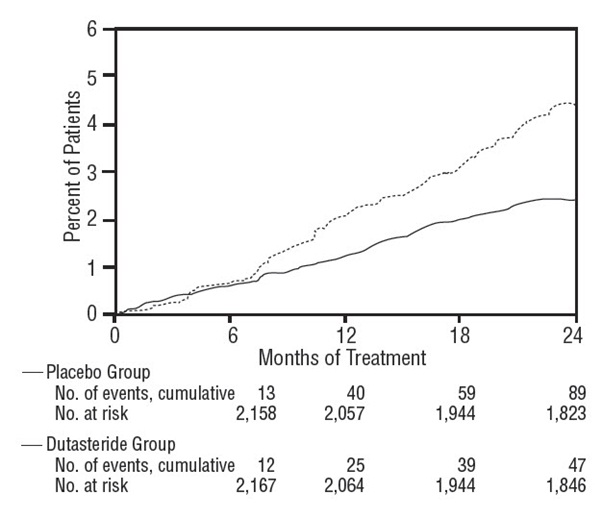
A line graph comparing the percent of patients experiencing events over 24 months of treatment between Dutasteride and placebo groups. The y-axis represents percent of patients (0 to 6%), and the x-axis shows months of treatment (0 to 24). The graph includes cumulative numbers of events and patients at risk for both groups at intervals of 0, 6, 12, 18, and 24 months.*
FDA Label Image

44b80a39 9206 4f6f 82c5 12bb8ef0530e 05

44b80a39 9206 4f6f 82c5 12bb8ef0530e 05
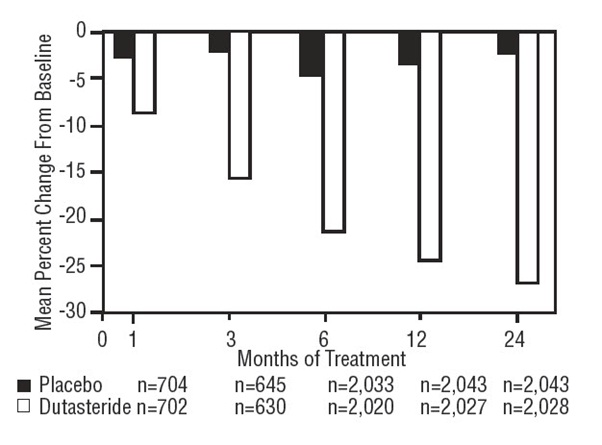
A bar chart showing the mean percent change from baseline over months of treatment for Dutasteride 0.5 mg liquid-filled capsules versus placebo. The x-axis indicates months of treatment (0, 1, 3, 6, 12, 24), and the y-axis shows mean percent change from baseline, with Dutasteride data bars consistently lower than placebo, representing greater mean reductions over time. Sample sizes for each group at each time point are indicated below the graph.*
FDA Label Image

44b80a39 9206 4f6f 82c5 12bb8ef0530e 06

44b80a39 9206 4f6f 82c5 12bb8ef0530e 06
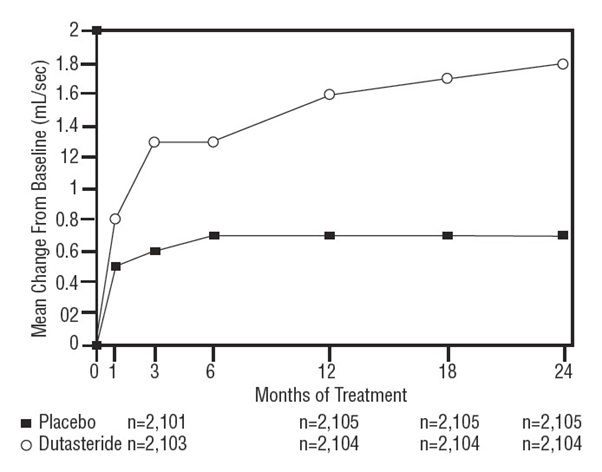
A line graph comparing the mean change from baseline in mL/sec over months of treatment for Dutasteride versus placebo. The x-axis represents months of treatment from 0 to 24, and the y-axis represents mean change from baseline in mL/sec ranging from 0 to 2. Dutasteride shows an increasing trend over time, while placebo remains relatively stable.*
FDA Label Image

44b80a39 9206 4f6f 82c5 12bb8ef0530e 07

44b80a39 9206 4f6f 82c5 12bb8ef0530e 07
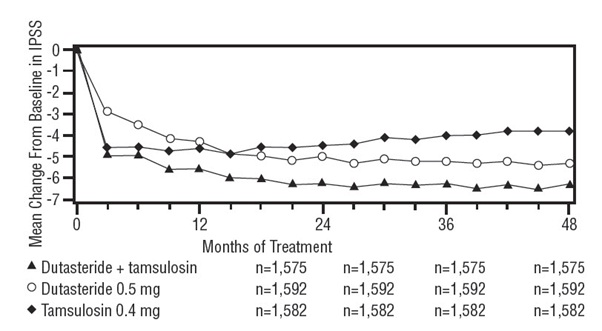
A line graph depicting mean change from baseline in IPSS (International Prostate Symptom Score) over 48 months of treatment. It compares three groups: Dutasteride with tamsulosin, Dutasteride 0.5 mg alone, and tamsulosin 0.4 mg alone, with sample sizes around 1,575, 1,592, and 1,582 respectively, showing treatment effects over time.*
FDA Label Image

44b80a39 9206 4f6f 82c5 12bb8ef0530e 08

44b80a39 9206 4f6f 82c5 12bb8ef0530e 08
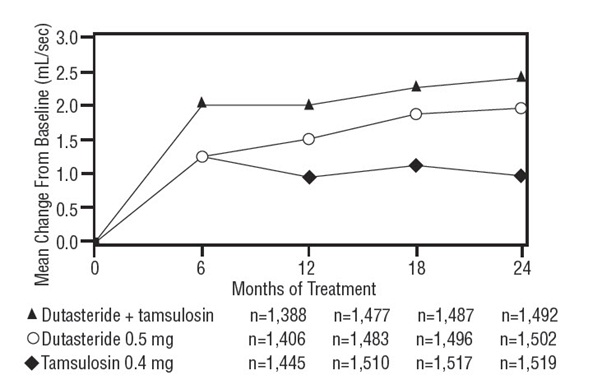
A line graph depicting the mean change from baseline in mL/sec over 24 months of treatment. It compares three groups: Dutasteride plus tamsulosin, Dutasteride 0.5 mg, and Tamsulosin 0.4 mg. The x-axis represents treatment duration in months, and the y-axis shows mean change values.*
FDA Label Image

44b80a39 9206 4f6f 82c5 12bb8ef0530e 09

44b80a39 9206 4f6f 82c5 12bb8ef0530e 09
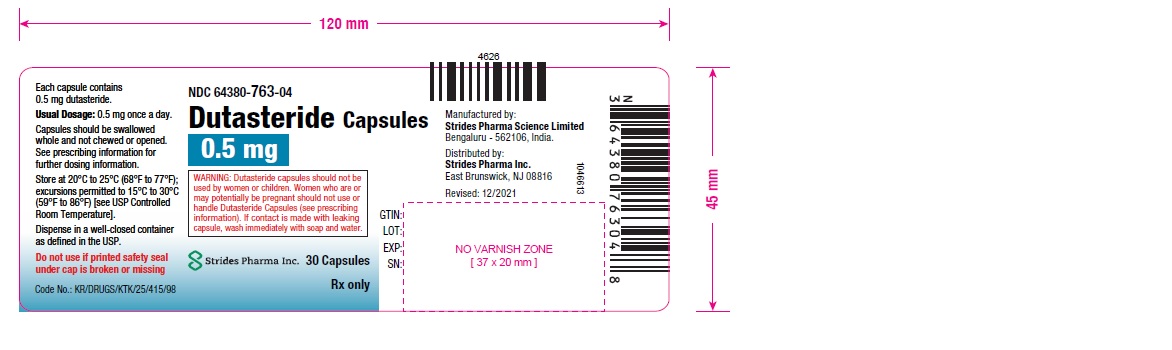
Dutasteride 0.5 mg capsules label showing a liquid-filled oral capsule dosage form. The label states each capsule contains 0.5 mg dutasteride with a usual dosage of 0.5 mg once daily. It is manufactured by Strides Pharma Science Limited, Bangalore, India, and distributed by Strides Pharma Inc., East Brunswick, NJ. The package contains 30 capsules and is marked Rx only. The label includes storage instructions and a warning that Dutasteride capsules should not be used by women or children.*
FDA Label Image

44b80a39 9206 4f6f 82c5 12bb8ef0530e 10

44b80a39 9206 4f6f 82c5 12bb8ef0530e 10
Label for Dutasteride Capsules 0.5 mg liquid-filled oral capsules by Strides Pharma Science Limited. The label includes dosage information, warnings, storage instructions, and states there are 90 capsules in the container. It also shows barcodes, lot, expiration fields, and manufacturer and distributor details.*

* About these descriptions: Image descriptions on this page are generated by automated AI analysis of the product label images from the manufacturer's FDA label submission (SPL). They are provided for reference only and may contain errors or omissions. Always rely on the printed label itself and the official FDA labeling, and consult a pharmacist or healthcare professional with any questions about this product.