Tys00 0058 01
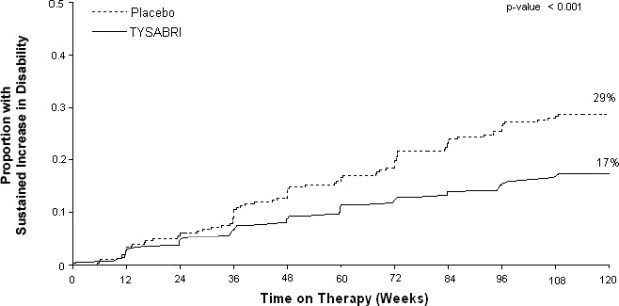
The text seems to represent a graph or a chart showing the proportion of individuals experiencing a sustained increase in disability after receiving therapy for a certain number of weeks. The data shows that after 108 weeks of therapy, the proportion is 17%, and it remains the same after 120 weeks of therapy.*

