Oxcarbazepine
Product Images NDC 64725-0137

8 FDA label images from Tya Pharmaceuticals · Packaging, Regulatory Labels, and Product Appearance

Product Visual Gallery

This gallery contains 8 technical images submitted to the FDA as part of the official labeling for Oxcarbazepine (NDC 64725-0137). Unlike standard consumer photos, these assets often include clinical data figures, molecular chemical structures, and official manufacturer packaging layouts.

As provided by Tya Pharmaceuticals, these visuals offer a comprehensive scientific overview of the product's physical and chemical identity, aiding pharmacists and researchers in product verification and study.

FDA Label Image

Label Image (64725 0137)
Label Image (64725 0137)
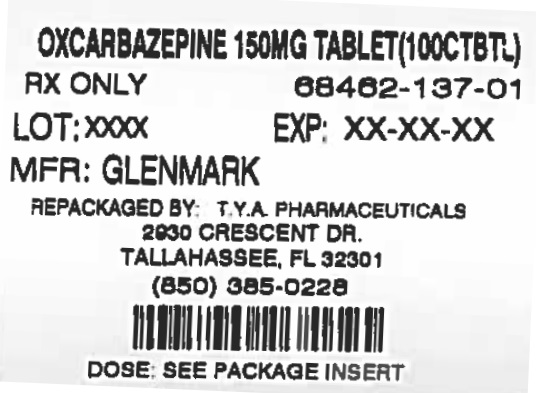
Label for Oxcarbazepine 150 mg tablets, packaged in a quantity of 100 tablets. The label includes prescription-only designation, lot number placeholder, expiration date placeholder, manufacturer listed as Glenmark, and repackaged by TYA Pharmaceuticals in Tallahassee, FL. Barcode and contact phone number are also shown, with instructions to refer to the package insert for dosing information.*
FDA Label Image

Oxcarbazepine Structure (D2d9579e 7536 442a 8d45 562e458d1651 01)

Oxcarbazepine Structure (D2d9579e 7536 442a 8d45 562e458d1651 01)
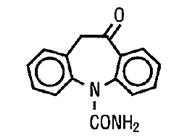
Chemical structure of oxcarbazepine. The diagram depicts the molecular framework including two aromatic rings, a lactam ring, and an amide group characteristic of oxcarbazepine's chemical composition.*
FDA Label Image

Figure 1 (D2d9579e 7536 442a 8d45 562e458d1651 02)

Figure 1 (D2d9579e 7536 442a 8d45 562e458d1651 02)
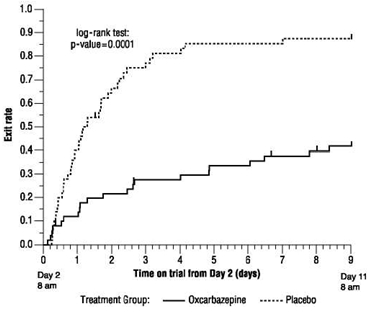
Kaplan-Meier survival curve depicting exit rates over time from Day 2 to Day 11 for two groups: Oxcarbazepine treatment and placebo. The x-axis shows time on trial in days from Day 2 8 am to Day 11 8 am, and the y-axis shows exit rate from 0.0 to 1.0. The curve for Oxcarbazepine (dotted line) shows a higher exit rate compared to placebo (solid line), with the log-rank test p-value of 0.0001 indicated on the graph.*
FDA Label Image

Figure 2 (D2d9579e 7536 442a 8d45 562e458d1651 03)

Figure 2 (D2d9579e 7536 442a 8d45 562e458d1651 03)
Kaplan-Meier seizure rate graph comparing Oxcarbazepine and Placebo groups over days from first dose to first seizure. The solid line represents Oxcarbazepine treatment, and the dotted line represents Placebo. A log-rank test with p-value 0.046 is noted, indicating statistical comparison between curves.*
FDA Label Image

Figure 3 (D2d9579e 7536 442a 8d45 562e458d1651 04)

Figure 3 (D2d9579e 7536 442a 8d45 562e458d1651 04)
A Kaplan-Meier survival curve depicting exit rate over time to exit in days for two treatment groups labeled HIGH (solid line) and LOW (dotted line). The chart includes a log-rank test p-value of 0.0001, indicating a statistically significant difference between the groups.*
FDA Label Image

Figure 4 (D2d9579e 7536 442a 8d45 562e458d1651 05)

Figure 4 (D2d9579e 7536 442a 8d45 562e458d1651 05)
A Kaplan-Meier survival curve graph showing the exit ratio over time in days for two treatment groups labeled as HIGH and LOW. The x-axis represents time to exit in days, and the y-axis shows the exit ratio from 0.0 to 1.0. The graph includes a log-rank test p-value of 0.0001, indicating a statistical comparison between the two groups.*
FDA Label Image

Glenmark Logo (D2d9579e 7536 442a 8d45 562e458d1651 06)

FDA Label Image

Glenmark Logo (D2d9579e 7536 442a 8d45 562e458d1651 07)

* About these descriptions: Image descriptions on this page are generated by automated AI analysis of the product label images from the manufacturer's FDA label submission (SPL). They are provided for reference only and may contain errors or omissions. Always rely on the printed label itself and the official FDA labeling, and consult a pharmacist or healthcare professional with any questions about this product.