Gabapentin
Product Images NDC 64725-0138

View Photos of Packaging, Regulatory Labels, and Product Appearance

Product Visual Gallery

This gallery contains 6 technical images submitted to the FDA as part of the official labeling for Gabapentin (NDC 64725-0138). Unlike standard consumer photos, these assets often include clinical data figures, molecular chemical structures, and official manufacturer packaging layouts.

As provided by Tya Pharmaceuticals, these visuals offer a comprehensive scientific overview of the product's physical and chemical identity, aiding pharmacists and researchers in product verification and study.

FDA Label Image

Label Image (64725 0138)

Label Image (64725 0138)
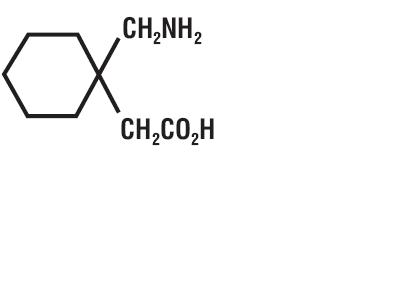
This is a description of a medication called Gabapentin, in the form of 300mg capsules. The medication comes in a bottle package containing 30 capsules. The manufacturer of the medication is Sun Pharmaceuticals, and it was packaged by T.Y.A. Pharmaceuticals located in Tallahassee, Florida. The bottle has a lot number of X0 and an expiration date of XX-XX-XX. The medication comes with an insert detailing the appropriate dosage, as it is not mentioned here.*
FDA Label Image

Gabapentin-fig01 (Gabapentin Fig01)

Gabapentin-fig01 (Gabapentin Fig01)
The text describes a graph showing weekly pain scores for a study with a dose titration period and a fixed dose period, comparing a placebo to a 3600 mg/day dose of Gabapentin. The graph displays a statistical significance level of p<0.01.*
FDA Label Image

Gabapentin-fig02 (Gabapentin Fig02)

Gabapentin-fig02 (Gabapentin Fig02)
The text describes a study on the effectiveness of Gabapentin in reducing pain. The study involved a 3-week dose titration period followed by a 4-week fixed dose period where patients were given either a placebo or Gabapentin in doses of 1800mg or 2400mg per day. The results of the study are shown in Figure 2 which displays weekly mean pain scores. It appears that Gabapentin, particularly in a dose of 2400mg per day, reduced pain significantly compared to the placebo group.*
FDA Label Image

Gabapentin-fig03 (Gabapentin Fig03)

Gabapentin-fig03 (Gabapentin Fig03)
The text describes the results of controlled postherpetic neuralgia (PHN) studies evaluating the percentage of patients with >50% reduction in pain score (i.e., responders) at endpoint for placebo (PBO) and gabapentin (GBP) treatment groups. The results are presented in Figure 3, with data from two separate studies, Study 1 and Study 2, shown for the GBP treatment group. The significance levels of the differences between the treatment groups are indicated with asterisks, with ***p<0.001 indicating a highly significant difference and **p<0.01 indicating a significant difference.*
FDA Label Image

Gabapentin-fig04 (Gabapentin Fig04)

Gabapentin-fig04 (Gabapentin Fig04)
This appears to be a description of a figure, possibly related to a study on Gabapentin as an adjunctive therapy for patients over 12 years of age with partial seizures. The figure shows the responder rates expressed as a difference from placebo by dose and study. The x-axis has values of 600, 900, 1200, and 1800 for daily dose in mg. The text does not provide any additional information about the study or its results.*
FDA Label Image

Gabapentin-structure (Gabapentin Structure)

* These product label images have been analyzed using experimental machine learning. Please verify findings with the primary label text.