Quetiapine Fumarate
Product Images NDC 64725-0145

5 FDA label images from Tya Pharmaceuticals · Packaging, Regulatory Labels, and Product Appearance

Product Visual Gallery

This gallery contains 5 technical images submitted to the FDA as part of the official labeling for Quetiapine Fumarate (NDC 64725-0145). Unlike standard consumer photos, these assets often include clinical data figures, molecular chemical structures, and official manufacturer packaging layouts.

As provided by Tya Pharmaceuticals, these visuals offer a comprehensive scientific overview of the product's physical and chemical identity, aiding pharmacists and researchers in product verification and study.

FDA Label Image

Label Image (64725 0145)

Label Image (64725 0145)
Label for Quetiapine fumarate 25 mg tablets, repackaged by TYA Pharmaceuticals in Tallahassee, FL. The label shows the manufacturer as Intas Pharma and includes typical prescription label elements such as lot number, expiration date placeholders, and a barcode. The label instructs to see the package insert for dosing information and notes a quantity of 30 tablets.*
FDA Label Image

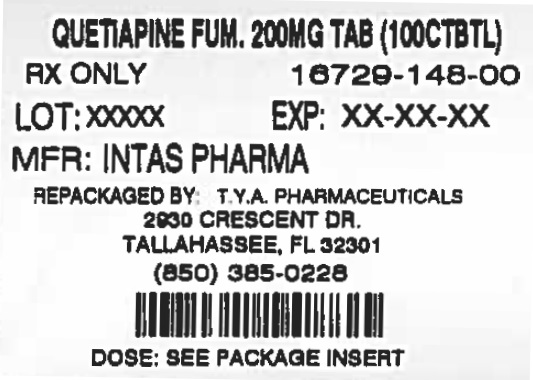
Label Image (64725 0148)

Label Image (64725 0148)
Label for Quetiapine fumarate 200 mg tablets in a 100 count bottle. Manufactured by Intas Pharma and repackaged by T.Y.A. Pharmaceuticals located in Tallahassee, FL. The label includes an NDC number, lot and expiration placeholders, dosing instruction to see package insert, and a barcode.*
FDA Label Image

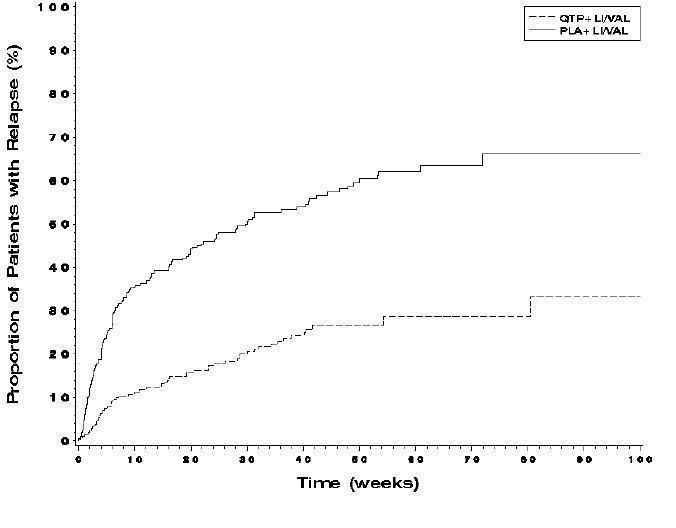
Figure 1 Kaplan-meier Curves Of Time To Recurrence Of A Mood Event (study 7) (Quetiapine Fig1)

Figure 1 Kaplan-meier Curves Of Time To Recurrence Of A Mood Event (study 7) (Quetiapine Fig1)
A line graph showing the proportion of patients with relapse (%) over time in weeks. Two groups are compared: QTP + LI/VAL and PLA + LI/VAL, represented by dashed and solid lines respectively. The x-axis indicates time in weeks up to 100, and the y-axis shows the percentage of patients with relapse from 0 to 100%.*
FDA Label Image

Figure 2 Kaplan-meier Curves Of Time To Recurrence Of A Mood Event (study 8) (Quetiapine Fig2)

Figure 2 Kaplan-meier Curves Of Time To Recurrence Of A Mood Event (study 8) (Quetiapine Fig2)
A Kaplan-Meier survival curve showing the proportion of patients with relapse (%) over time in weeks. The graph compares two groups, QTP+LIVAL (dashed line) and PLA+LIVAL (solid line), illustrating relapse rates up to around 100 weeks.*
FDA Label Image

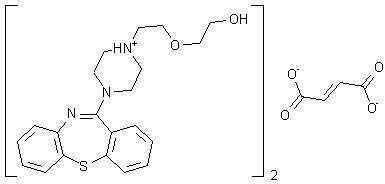
Chemstructure (Quetiapine Str)

Chemstructure (Quetiapine Str)
Chemical structure diagram of quetiapine fumarate showing the molecular arrangement of the active ingredient. The image depicts the quetiapine moiety along with the fumarate ion, illustrating the compound's chemical components as part of the pharmaceutical product by TYA Pharmaceuticals.*

* About these descriptions: Image descriptions on this page are generated by automated AI analysis of the product label images from the manufacturer's FDA label submission (SPL). They are provided for reference only and may contain errors or omissions. Always rely on the printed label itself and the official FDA labeling, and consult a pharmacist or healthcare professional with any questions about this product.