Product Images Duloxetine Delayed-release

View Photos of Packaging, Labels & Appearance

Product Label Images

The following 7 images provide visual information about the product associated with Duloxetine Delayed-release NDC 64725-0747 by Tya Pharmaceuticals, such as packaging, labeling, and the appearance of the drug itself. This resource could be helpful for medical professionals, pharmacists, and patients seeking to verify medication information and ensure they have the correct product.

Label Image - 64725 0747

Label Image - 64725 0747

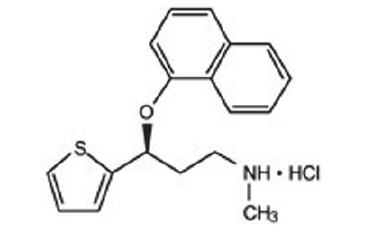
This is a description of a medication called Duloxetine DR 30mg capsule, which has been repackaged by T.Y.A. Pharmaceuticals. The medication is intended for prescription use only and comes in a bottle with 80 capsules. The bottle has a specific lot number and expiration date. The manufacturer of the medication is Laboratorios Dreste. The package insert should be consulted for dosage information.*

Chemical Structure - duloxetine 01

Chemical Structure - duloxetine 01

Figure 1 - duloxetine 02

Figure 1 - duloxetine 02

Figure 2 - duloxetine 03

Figure 2 - duloxetine 03

Figure 3 - duloxetine 04

Figure 3 - duloxetine 04

This image shows the percentage of patients who have improved in a study. It compares a placebo to a drug called CYM80/120 mg taken once daily. The x-axis indicates the percent improvement in pain from baseline (BOCF) and the y-axis shows the percentage of patients. The graph shows that a higher percentage of patients taking CYM80/120 mg had improved pain compared to those taking the placebo.*

Figure 4 - duloxetine 05

Figure 4 - duloxetine 05

This is a graph displaying the percentage of patients improved in pain from baseline with a placebo and CYM60 mg once daily. The x-axis shows the percent improvement in pain ranging from 0 to 100, and the y-axis shows the percentage of patients. The placebo group showed a 100% improvement in pain, while the CYM60 mg once daily group showed an improvement of 80%.*

Figure 5 - duloxetine 06

Figure 5 - duloxetine 06

This document appears to be a graph illustrating the percentage of patients who showed improvement in pain from baseline in a clinical trial. The x-axis shows different levels of pain improvement represented by numbers ranging from 0 to 100. The y-axis shows the percentage of patients who experienced that level of improvement. Two different lines are plotted on the graph: one for patients who received a placebo and another for patients who received a medication referred to as CYM60/120 mg once daily. There is no further information available.*

* The product label images have been analyzed using a combination of traditional computing and machine learning techniques. It should be noted that the descriptions provided may not be entirely accurate as they are experimental in nature. Use the information in this page at your own discretion and risk.