Figure 1: Mean Weight And Height Percentiles Over Time For Patients With Three Years Of Atomoxetine Treatment (Atomoxetine Fig1)
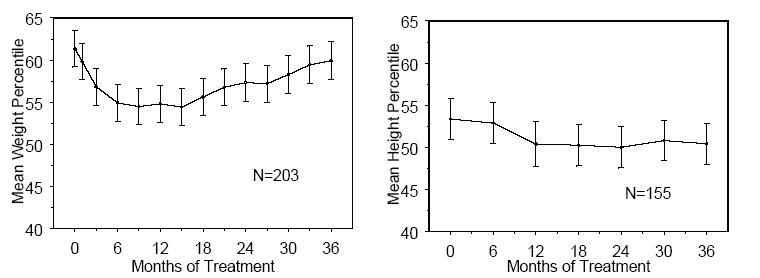
This appears to be a chart or graph showing the Mean Weight Percentile and Mean Height Percentile for two groups (N=203 and N=155) over a period of 36 months of treatment. However, without further context or information, it is difficult to determine the groups being compared or the type of treatment being evaluated.*