Memantine Hydrochloride Tablet, Film Coated
Product Images NDC 65162-169

View Photos of Packaging, Regulatory Labels, and Product Appearance

Product Visual Gallery

This gallery contains 11 technical images submitted to the FDA as part of the official labeling for Memantine Hydrochloride (NDC 65162-169). Unlike standard consumer photos, these assets often include clinical data figures, molecular chemical structures, and official manufacturer packaging layouts.

As provided by Amneal Pharmaceuticals Llc, these visuals offer a comprehensive scientific overview of the product's physical and chemical identity, aiding pharmacists and researchers in product verification and study.

FDA Label Image

1 (Memantine HCl Tablets Usp 1)

1 (Memantine HCl Tablets Usp 1)
Chemical structure of memantine hydrochloride showing its bicyclic amine structure with methyl groups and an attached hydrochloride group.*
FDA Label Image

1 (Memantine HCl Tablets Usp 10)

1 (Memantine HCl Tablets Usp 10)
Memantine Hydrochloride Tablets USP 5 mg film-coated tablets label showing a 60-tablet package. The label includes storage instructions, manufacturing details by Amneal Pharmaceuticals Pvt. Ltd. and distribution by Amneal Pharmaceuticals LLC. The packaging also displays an NDC number and usage precautions.*
FDA Label Image

1 (Memantine HCl Tablets Usp 11)

1 (Memantine HCl Tablets Usp 11)
Memantine Hydrochloride Tablets, USP 10 mg film-coated tablets in a 60-count package from Amneal Pharmaceuticals LLC. The label includes storage instructions, dosage advisory to refer to package insert, and manufacturer information (Amneal Pharmaceuticals Pvt. Ltd., India). The packaging shows the NDC 65162-169-06 and the tablets are marked with 'IP 174'.*
FDA Label Image

1 (Memantine HCl Tablets Usp 2)

1 (Memantine HCl Tablets Usp 2)
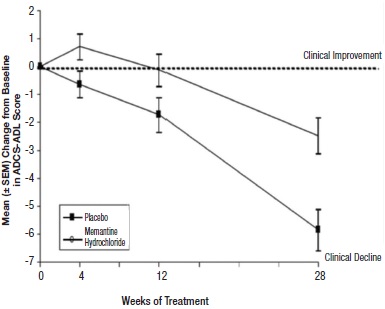
A line graph showing mean change from baseline in ADCS-ADL score over 28 weeks of treatment. The x-axis represents weeks of treatment (0, 4, 12, 28) and the y-axis shows mean change with error bars. Two lines compare placebo and memantine hydrochloride, with memantine showing less decline over time. The graph includes labels for clinical improvement and clinical decline.*
FDA Label Image

1 (Memantine HCl Tablets Usp 3)

1 (Memantine HCl Tablets Usp 3)
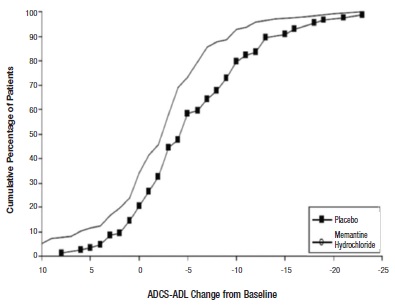
A cumulative percentage of patients chart showing ADCS-ADL change from baseline for memantine hydrochloride and placebo groups. The x-axis represents the change from baseline, while the y-axis represents the cumulative percentage of patients. Two curves are displayed, one for memantine hydrochloride and one for placebo, indicating different response distributions between the groups.*
FDA Label Image

1 (Memantine HCl Tablets Usp 4)

1 (Memantine HCl Tablets Usp 4)
A line graph depicting the mean change from baseline on the SIB score over 28 weeks of treatment comparing Placebo and Memantine Hydrochloride groups. The x-axis represents weeks of treatment, and the y-axis represents mean change in SIB score, with clinical improvement indicated above zero and clinical decline below. Memantine Hydrochloride shows less decline over time compared to Placebo, with error bars shown for variability.*
FDA Label Image

1 (Memantine HCl Tablets Usp 5)

1 (Memantine HCl Tablets Usp 5)
A cumulative percentage of patients chart showing changes from baseline in SIB (Severe Impairment Battery) scores. The x-axis represents the SIB change from baseline ranging from 15 to -30, while the y-axis shows the cumulative percentage of patients from 0 to 100%. Two curves are depicted, one for placebo and one for memantine hydrochloride, with memantine showing a higher cumulative percentage at greater negative SIB changes.*
FDA Label Image

1 (Memantine HCl Tablets Usp 6)

1 (Memantine HCl Tablets Usp 6)
A line graph comparing mean ADCS-ADL scores from baseline over 24 weeks of treatment for placebo/donepezil and memantine hydrochloride/donepezil groups. The y-axis represents mean score change, with lines indicating clinical improvement and decline. Data points include error bars.*
FDA Label Image

1 (Memantine HCl Tablets Usp 7)

1 (Memantine HCl Tablets Usp 7)
A line graph showing the cumulative percentage of patients on the vertical axis and ADCS-ADL change from baseline on the horizontal axis. Two curves compare Placebo/Donepezil and Memantine Hydrochloride/Donepezil treatment groups, illustrating patient response distribution over a range of ADCS-ADL score changes.*
FDA Label Image

1 (Memantine HCl Tablets Usp 8)

1 (Memantine HCl Tablets Usp 8)
A line graph showing mean change from baseline in SIS score over 24 weeks of treatment. It compares three groups: Placebo/Donepezil, Memantine, and Memantine Hydrochloride/Donepezil, with mean ± SEM values plotted at intervals from 0 to 24 weeks. The graph indicates clinical improvement above the baseline and clinical decline below.*
FDA Label Image

1 (Memantine HCl Tablets Usp 9)

1 (Memantine HCl Tablets Usp 9)
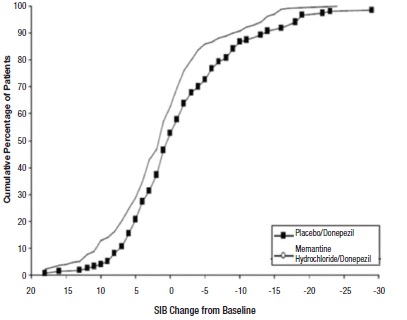
A cumulative percentage of patients graph showing SIB (Severe Impairment Battery) change from baseline. The graph compares three groups: Placebo/Donepezil, Memantine, and Hydrochloride/Donepezil, with data points plotted over a range of SIB change values from 20 to -30 on the x-axis and cumulative percentage from 0 to 100 on the y-axis.*

* About these descriptions: Image descriptions on this page are generated by automated AI analysis of the product label images from the manufacturer's FDA label submission (SPL). They are provided for reference only and may contain errors or omissions. Always rely on the printed label itself and the official FDA labeling, and consult a pharmacist or healthcare professional with any questions about this product.