Argatroban Injection
Product Images NDC 65219-429

View Photos of Packaging, Regulatory Labels, and Product Appearance

Product Visual Gallery

This gallery contains 8 technical images submitted to the FDA as part of the official labeling for Argatroban (NDC 65219-429). Unlike standard consumer photos, these assets often include clinical data figures, molecular chemical structures, and official manufacturer packaging layouts.

As provided by Fresenius Kabi Usa, Llc, these visuals offer a comprehensive scientific overview of the product's physical and chemical identity, aiding pharmacists and researchers in product verification and study.

FDA Label Image

Figure (Arg07 0000 01)
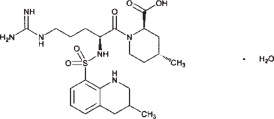
Figure (Arg07 0000 01)
Chemical structure of Argatroban displayed as a 2D molecular diagram indicating its atomic connections and functional groups.*
FDA Label Image

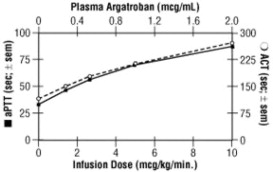
Figure 1 (Arg07 0000 02)

Figure 1 (Arg07 0000 02)
A line graph depicting the relationship between infusion dose (mcg/kg/min) on the x-axis and plasma Argatroban concentration (mcg/mL) and ACT (sec ± sem) on the y-axes. The graph shows an increasing trend in both plasma Argatroban levels and ACT corresponding to higher infusion doses.*
FDA Label Image

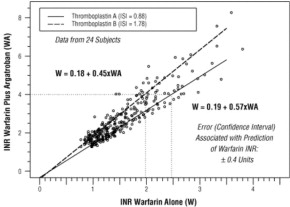
Figure 2 (Arg07 0000 03)

Figure 2 (Arg07 0000 03)
A scatter plot chart comparing INR (International Normalized Ratio) values of Warfarin alone versus Warfarin plus Argatroban, based on data from 24 subjects. The chart includes trend lines for two different Thromboplastin ISI values (0.88 and 1.78) and equations for W as a function of WA. It also notes the confidence interval error associated with predicting Warfarin INR.*
FDA Label Image

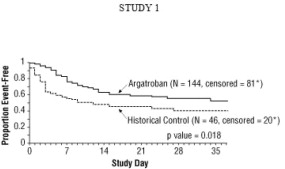
Figure 3 (Arg07 0000 04)

Figure 3 (Arg07 0000 04)
A line graph labeled 'STUDY 1' displaying the proportion of event-free subjects over study days. Two groups are shown: Argatroban (N=144, censored=81) and Historical Control (N=46, censored=21). The graph includes a p value of 0.018, indicating a comparison of event-free proportions between the groups over time.*
FDA Label Image

Figure 4 (Arg07 0000 05)

Figure 4 (Arg07 0000 05)
A Kaplan-Meier survival curve comparing the proportion of event-free subjects over a 35-day study period for Argatroban (N=160) versus Historical Control (N=147). The graph shows higher event-free proportions for Argatroban, with a reported p value of 0.007.*
FDA Label Image

Fresenius Kabi Logo (Arg07 0000 06)

Fresenius Kabi Logo (Arg07 0000 06)
Argatroban 50 mg/50 mL intravenous injection vial label from Fresenius Kabi USA, LLC. The image shows a clear glass vial with a green and white label featuring the product name, strength, dosage form, and the labeler name. The vial has a green flip-off cap.*
FDA Label Image

Principal Display Panel – 50 mg/50 mL – Vial Label (Arg07 0000 07)

Principal Display Panel – 50 mg/50 mL – Vial Label (Arg07 0000 07)
Argatroban Injection 50 mg/50 mL (1 mg/mL) single-dose vial label. The label includes dosing instructions stating not to dilute before administration and that it is for intravenous infusion only. Manufactured by Fresenius Kabi USA, LLC, Lake Zurich, IL, with the product made in India. The label also lists inactive ingredients and storage instructions.*
FDA Label Image

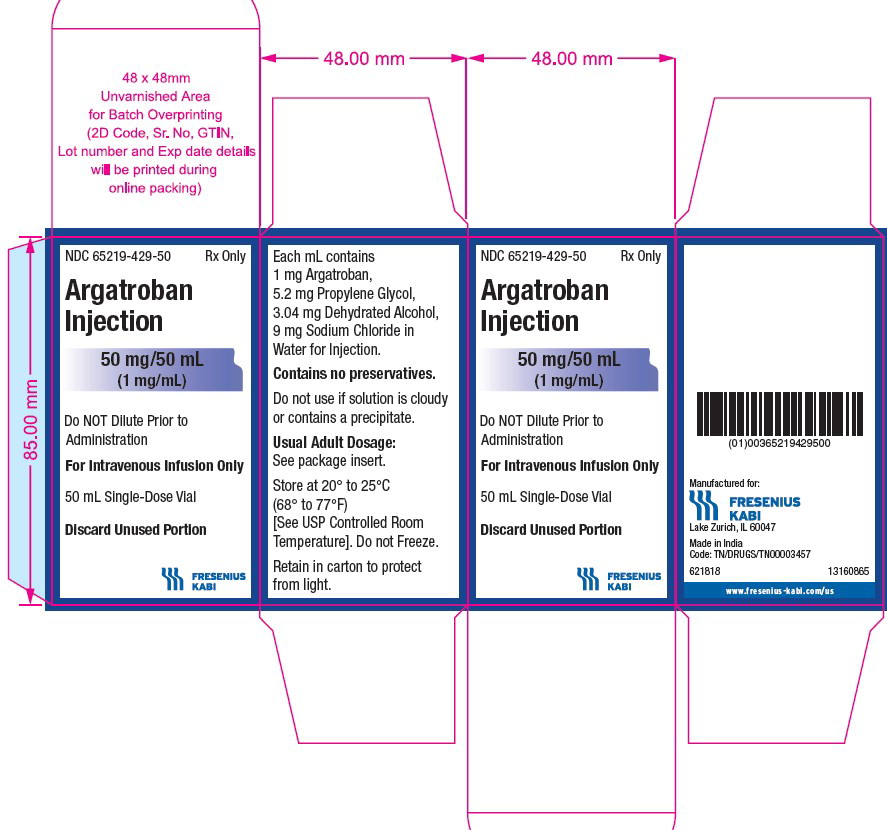
Principal Display Panel – 50 mg/50 mL – Carton (Arg07 0000 08)

Principal Display Panel – 50 mg/50 mL – Carton (Arg07 0000 08)
Label for Argatroban Injection 50 mg/50 mL (1 mg/mL) single-dose vial by Fresenius Kabi USA, LLC. The label includes dosage form intravenous infusion only, storage instructions, and bar code. The label states the vial contains argatroban and other ingredients, specifying no preservatives.*

* About these descriptions: Image descriptions on this page are generated by automated AI analysis of the product label images from the manufacturer's FDA label submission (SPL). They are provided for reference only and may contain errors or omissions. Always rely on the printed label itself and the official FDA labeling, and consult a pharmacist or healthcare professional with any questions about this product.