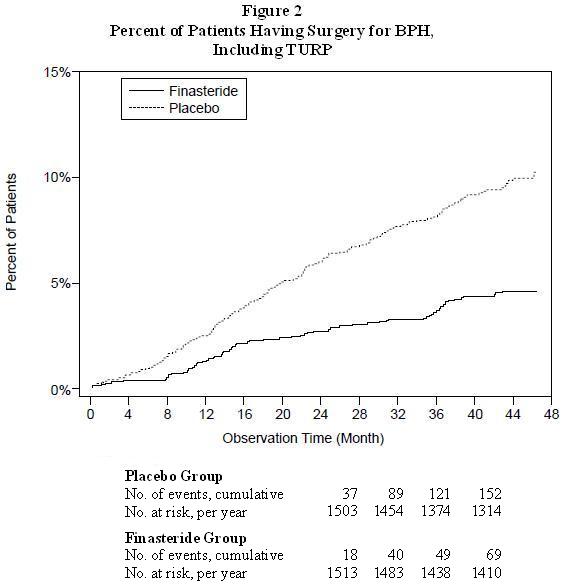
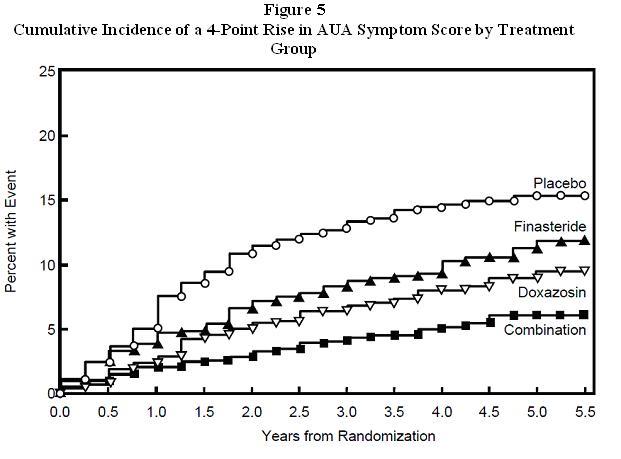
Figure 1 Symptom Score In A Long-term Efficacy And Safety Study (Finasteride Fig1)

The text appears to be a table showing mean change from baseline + 1 SE, along with a figure indicating symptom score in 2 long term efficacy and safety studies. The table compares the results of a placebo treatment versus a treatment of Finasteride, with baseline and yearly scores over four years. Therefore, it can be inferred that the context of this text is a medical study, likely exploring the effectiveness and safety of Finasteride as a treatment for a particular medical condition.*