Levetiracetam Solution
Product Images NDC 65862-250

View Photos of Packaging, Regulatory Labels, and Product Appearance

Product Visual Gallery

This gallery contains 8 technical images submitted to the FDA as part of the official labeling for Levetiracetam (NDC 65862-250). Unlike standard consumer photos, these assets often include clinical data figures, molecular chemical structures, and official manufacturer packaging layouts.

As provided by Aurobindo Pharma Limited, these visuals offer a comprehensive scientific overview of the product's physical and chemical identity, aiding pharmacists and researchers in product verification and study.

FDA Label Image

Figure 1: Responder Rate (≥50% Reduction From Baseline) In Study 1 (Levetiracetam Fig1)

Figure 1: Responder Rate (≥50% Reduction From Baseline) In Study 1 (Levetiracetam Fig1)
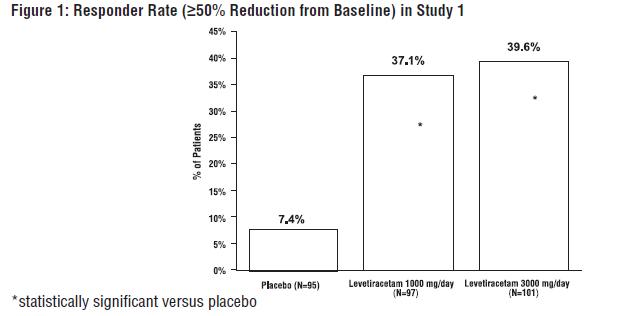
The text describes a figure (Figure 1) that shows the responder rate in Study 1. The figure indicates a 250% reduction from the baseline. The text also mentions two drugs, Lovecetam 100 mg and Lovtiactan 3000 mg, which were compared to a placebo. The results show a statistically significant difference between the drugs and the placebo.*
FDA Label Image

Figure 2: Responder Rate (≥50% Reduction From Baseline) In Study 2: Period A (Levetiracetam Fig2)

FDA Label Image

Figure 3: Responder Rate (≥50% Reduction From Baseline) In Study 3 (Levetiracetam Fig3)

FDA Label Image

Figure 4: Responder Rate (≥ 50% Reduction From Baseline) In Study 4 (Levetiracetam Fig4)

Figure 4: Responder Rate (≥ 50% Reduction From Baseline) In Study 4 (Levetiracetam Fig4)
The given text is a graph with the title "Responder Rate (250% Reduction from Baseline) in Study 4". It shows the response rate in percentages for the placebo and Levetiracetam groups. The Levetiracetam group had a significantly higher responder rate compared to the placebo group. Therefore, this graph represents the effectiveness of Levetiracetam.*
FDA Label Image

Figure 5: Responder Rate For All Patients Ages 1 Month To < 4 Years (≥ 50% Reduction From Baseline) In Study 5 (Levetiracetam Fig5)

FDA Label Image

Table 15: Median Percent Reduction From Baseline In Pgtc Seizure Frequency Per Week In Study 7 (Levetiracetam Fig6)

Table 15: Median Percent Reduction From Baseline In Pgtc Seizure Frequency Per Week In Study 7 (Levetiracetam Fig6)
The text provides a figure that shows the responder rate in PGTC seizure frequency per week in Study 7. It presents percentages of patients who responded to treatment with Levetiracetam compared to a placebo. The results highlight a statistically significant reduction in seizure frequency for patients treated with Levetiracetam.*
FDA Label Image

Package Label-principal Display Panel (100 mg/mL (473 mL Bottle))

FDA Label Image

Chemical Structure (Levetiracetam Str)

* These product label images have been analyzed using experimental machine learning. Please verify findings with the primary label text.