Figure 1 (Perindopril Fig1)
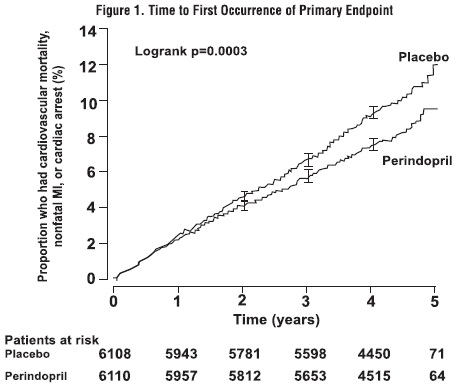
This is a graph showing the Time to First Occurrence of Primary Endpoint with logrank p=0.0003 for Placebo and Perindopril. The primary endpoint being the cardiovascular mortality, nonfatal MI, or cardiac arrest. The x-axis is time in years and the y-axis is the proportion of people who had the primary endpoint. The graph shows that Perindopril has a lower proportion of people with the primary endpoint compared to the Placebo. The number of patients at risk is also provided for each group at different times.*