Clopidogrel Tablet, Film Coated
Product Images NDC 65862-357

View Photos of Packaging, Regulatory Labels, and Product Appearance

Product Visual Gallery

This gallery contains 11 technical images submitted to the FDA as part of the official labeling for Clopidogrel (NDC 65862-357). Unlike standard consumer photos, these assets often include clinical data figures, molecular chemical structures, and official manufacturer packaging layouts.

As provided by Aurobindo Pharma Limited, these visuals offer a comprehensive scientific overview of the product's physical and chemical identity, aiding pharmacists and researchers in product verification and study.

FDA Label Image

Figure 1 (Clopidogrel Fig1)

Figure 1 (Clopidogrel Fig1)
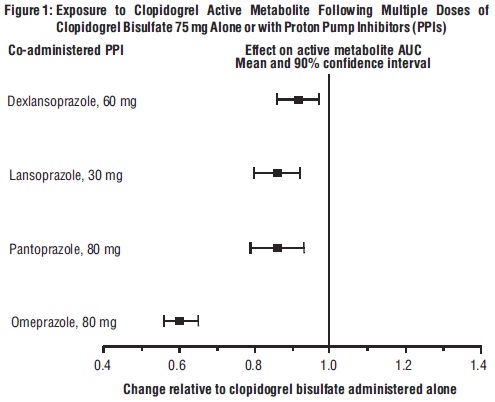
The text describes a figure showing the effect of co-administered proton pump inhibitors (PPIs) on the exposure to Clopidogrel Active Metabolite following multiple doses of Clopidogrel Bisulfate 75 mg. The figure represents the mean and 90% confidence interval of the effect of Dexlansoprazole, Lansoprazole, Pantoprazole, and Omeprazole on the AUC (area under the curve) of the active metabolite. The text also shows the change relative to Clopidogrel Bisulfate administered alone.*
FDA Label Image

Package Label-principal Display Panel (75 mg Blister Carton (10 x 10 Unit-dose))

FDA Label Image

Figure 2: Cardiovascular Death, Myocardial Infarction, And Stroke In The Cure Study (Clopidogrel Fig2)

Figure 2: Cardiovascular Death, Myocardial Infarction, And Stroke In The Cure Study (Clopidogrel Fig2)
This is a graph that shows the cumulative event rate of cardiovascular death, myocardial infarction, and stroke in patients taking either Plagebo (Placebo + aspirin) or Clopidogrel Bisulfate (Clopidogrel + aspirin) over a 12 month follow-up period. The use of standard therapies as appropriate is noted. The data suggests that Clopidogrel Bisulfate + aspirin is associated with a lower cumulative event rate compared to Plagebo + aspirin. The P-value for the comparison is 0.00009.*
FDA Label Image

Figure-3 (Clopidogrel Fig3)

Figure-3 (Clopidogrel Fig3)
Not available.*
FDA Label Image

Figure 4: Cumulative Event Rates For Death In The Commit Study (Clopidogrel Fig4)

Figure 4: Cumulative Event Rates For Death In The Commit Study (Clopidogrel Fig4)
The text describes a comparison between placebo and Clopidogrel using % dead before first discharge. The data shows that Clopidogrel had a 7% proportional risk reduction compared to placebo with a p-value of 0.03. The chart shows the number of deaths over time (up to 28 days) for both groups.*
FDA Label Image

Figure 5: Cumulative Event Rates For The Combined Endpoint Re-infarction, Stroke Or Death In The Commit Study (Clopidogrel Fig5)

Figure 5: Cumulative Event Rates For The Combined Endpoint Re-infarction, Stroke Or Death In The Commit Study (Clopidogrel Fig5)
The text appears to be from a clinical study report comparing the event rates of two groups receiving different treatments, specifically Clopidogrel and Placebo. The study measured the percentage of patients who experienced an event within a certain timeframe after randomization. The data suggests that Clopidogrel had a lower proportion of events compared to the Placebo group, demonstrating a statistical significance. The timeframe measured was up to 28 days since randomization.*
FDA Label Image

Figure 6: Effects Of Adding Clopidogrel Bisulfate To Aspirin On The Combined Primary Endpoint Across Baseline And Concomitant Medication Subgroups For The Commit Study (Clopidogrel Fig6)

FDA Label Image

Figure 7: Fatal Or Non-fatal Vascular Events In The Caprie Study (Clopidogrel Fig7)

FDA Label Image

Figure 8: Hazard Ratio And 95% Ci By Baseline Subgroups In The Caprie Study (Clopidogrel Fig8)

Figure 8: Hazard Ratio And 95% Ci By Baseline Subgroups In The Caprie Study (Clopidogrel Fig8)
This appears to be a table showing the results of a study evaluating the effectiveness of Clopidogrel Bisulfate and Aspirin for preventing health conditions such as Stroke, MI, and PAD. The table shows the number of participants who qualified for the study and the percentage of those who were given each treatment. There is also a graph showing the comparisons between the treatments and their effectiveness over several years. The last column of the table shows the Hazard Ratio with a 95% Confidence Interval. It is unclear what the "Favors" section of the graph represents.*
FDA Label Image

Package Label-principal Display Panel (75 mg (30 Tablets Bottle))

Package Label-principal Display Panel (75 mg (30 Tablets Bottle))
This text describes a medication called Clopidogrel Tablets, USP. The text provides the NDC code, dosage information, and storage requirements. It also instructs pharmacists to dispense a separate medication guide to each patient. The tablets are distributed by Aurobindo Pharma USA, Inc. and are made in India. There is also information regarding the printing area, with a dotted line marking an area not to be printed.*
FDA Label Image

Chemical Structure (Clopidogrel Str)

* These product label images have been analyzed using experimental machine learning. Please verify findings with the primary label text.