Galantamine Tablet, Film Coated
Product Images NDC 65862-458

16 FDA label images from Aurobindo Pharma Limited · Packaging, Regulatory Labels, and Product Appearance

Product Visual Gallery

This gallery contains 16 technical images submitted to the FDA as part of the official labeling for Galantamine (NDC 65862-458). Unlike standard consumer photos, these assets often include clinical data figures, molecular chemical structures, and official manufacturer packaging layouts.

As provided by Aurobindo Pharma Limited, these visuals offer a comprehensive scientific overview of the product's physical and chemical identity, aiding pharmacists and researchers in product verification and study.

FDA Label Image

Figure 1: Time-course Of The Change From Baseline In Adas-cog Score For Patients Completing 21 Weeks (5 Months) Of Treatment (Galantamine Fig1)
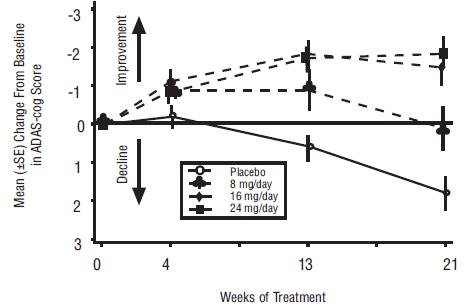
Figure 1: Time-course Of The Change From Baseline In Adas-cog Score For Patients Completing 21 Weeks (5 Months) Of Treatment (Galantamine Fig1)
A line graph depicting mean change from baseline in ADAS-cog score over 21 weeks of treatment. The graph compares four groups: Placebo, 8 mg/day, 16 mg/day, and 24 mg/day doses of galantamine. The vertical axis shows improvement and decline in scores, while the horizontal axis indicates weeks of treatment.*
FDA Label Image

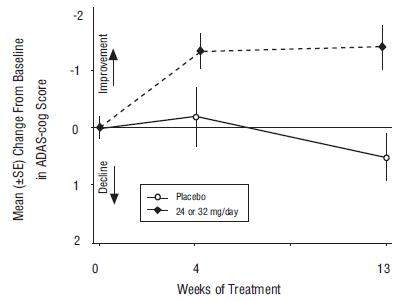
Figure 10: Time-course Of The Change From Baseline In Adas-cog Score For Patients Completing 13 Weeks Of Treatment (Galantamine Fig10)

Figure 10:	Time-course Of The Change From Baseline In Adas-cog Score For Patients Completing 13 Weeks Of Treatment (Galantamine Fig10)
A line graph illustrating the mean change in ADAS-cog scores from baseline over 13 weeks of treatment. The chart compares the placebo group and the group receiving 24 or 32 mg/day doses of Galantamine, showing improvement in cognitive scores with Galantamine while placebo shows minimal change.*
FDA Label Image

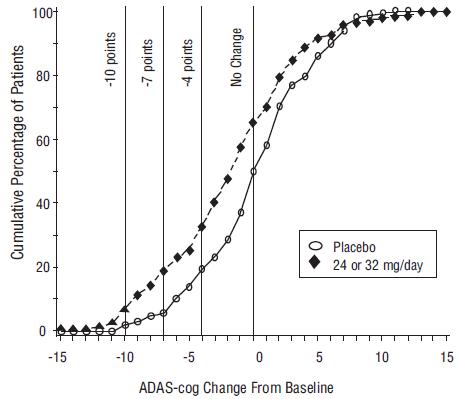
Figure 11: Cumulative Percentage Of Patients Completing 13 Weeks Of Double-blind Treatment With Specified Changes From Baseline In Adas-cog Scores. The Percentages Of Randomized Patients Who Completed The Study Were: Placebo 90%, 24 To 32 mg/day 67%. (Galantamine Fig11)

Figure 11:	Cumulative Percentage Of Patients Completing 13 Weeks Of Double-blind Treatment With Specified Changes From Baseline In Adas-cog Scores. The Percentages Of Randomized Patients Who Completed The Study Were: Placebo 90%, 24 To 32 mg/day 67%. (Galantamine Fig11)
A cumulative percentage graph comparing ADAS-cog change from baseline between Placebo and Galantamine (24 or 32 mg/day) groups in patients. The x-axis shows ADAS-cog score changes ranging from -15 to 15, while the y-axis shows the cumulative percentage of patients from 0 to 100%.*
FDA Label Image

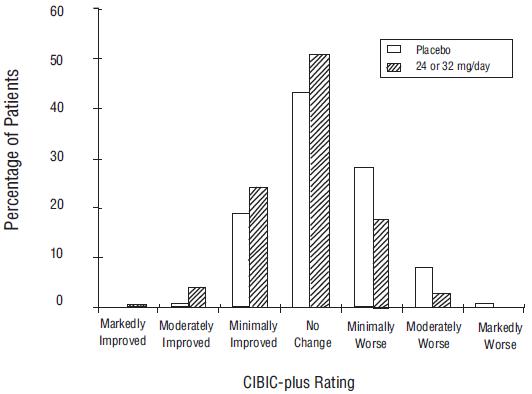
Figure 12 (Galantamine Fig12)

Figure 12 (Galantamine Fig12)
Bar chart comparing the percentage of patients by CIBIC-plus Rating categories between placebo and 24 or 32 mg/day treatment groups. The x-axis shows the CIBIC-plus Rating categories from Markedly Improved to Markedly Worse, and the y-axis shows the percentage of patients. The chart visually displays patient response distribution in each group.*
FDA Label Image

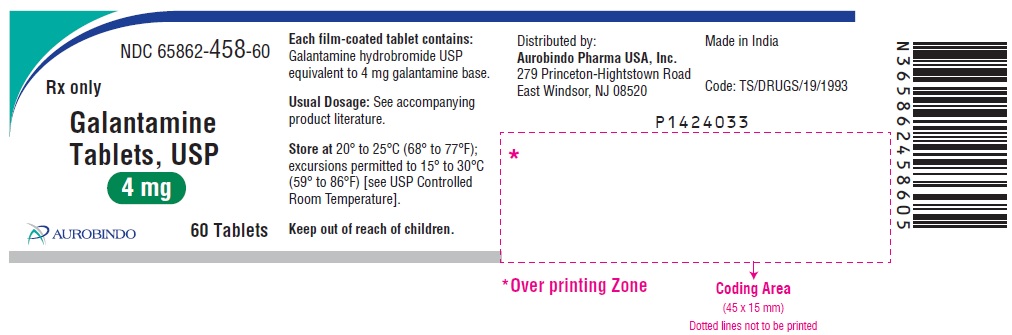
Package Label-principal Display Panel (4 mg (60 Tablets Bottle))

Package Label-principal Display Panel (4 mg (60 Tablets Bottle))
Label for Galantamine Tablets, USP 4 mg film-coated tablets from Aurobindo Pharma Limited. The label indicates 60 tablets per package, with instructions and storage conditions, and includes distributor information for Aurobindo Pharma USA, Inc. It notes the product is made in India and has a 4 mg strength.*
FDA Label Image

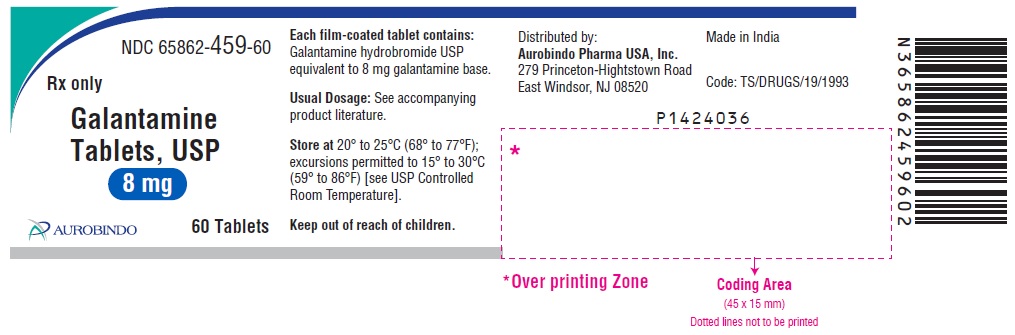
Package Label-principal Display Panel (8 mg (60 Tablets Bottle))

Package Label-principal Display Panel (8 mg (60 Tablets Bottle))
Label for Galantamine Tablets, USP 8 mg film-coated tablets, distributed by Aurobindo Pharma USA, Inc. The label displays the drug name, strength (8 mg), dosage form, and quantity (60 tablets). It includes storage instructions, manufacturer location (Made in India), and barcodes along with regulatory information and usage directions.*
FDA Label Image

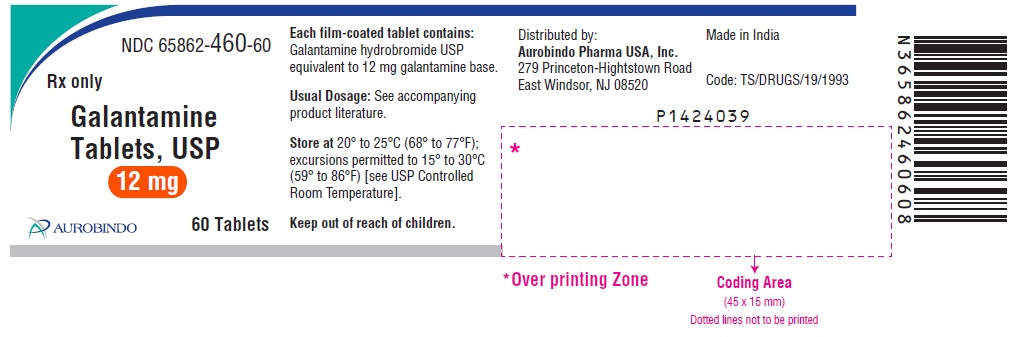
Package Label-principal Display Panel -12 mg (60 Tablets Bottle) (Galantamine Fig15)

Package Label-principal Display Panel -12 mg (60 Tablets Bottle) (Galantamine Fig15)
Label for Galantamine Tablets USP 12 mg film-coated tablets, containing 60 tablets per bottle. The label shows this is a prescription drug distributed by Aurobindo Pharma USA, Inc., made in India. The label includes storage instructions, dosage note, and a barcode on the right side.*
FDA Label Image

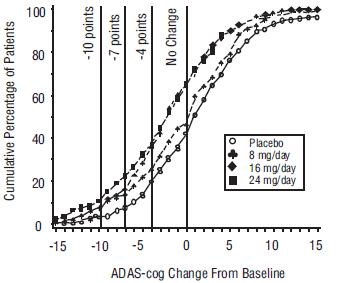
Figure 2: Cumulative Percentage Of Patients Completing 21 Weeks Of Double-blind Treatment With Specified Changes From Baseline In Adas-cog Scores. The Percentages Of Randomized Patients Who Completed The Study Were: Placebo 84%, 8 mg/day 77%, 16 mg/day 78% And 24 mg/day 78%. (Galantamine Fig2)

Figure 2: Cumulative Percentage Of Patients Completing 21 Weeks Of Double-blind Treatment With Specified Changes From Baseline In Adas-cog Scores. The Percentages Of Randomized Patients Who Completed The Study Were: Placebo 84%, 8 mg/day 77%, 16 mg/day 78% And 24 mg/day 78%. (Galantamine Fig2)
A cumulative percentage of patients chart showing ADAS-cog change from baseline for placebo and three dosages of galantamine (8 mg/day, 16 mg/day, and 24 mg/day). The x-axis represents the ADAS-cog change from baseline, ranging from -15 to 15, while the y-axis shows the cumulative percentage of patients up to 100%. Vertical lines mark thresholds at -10, -7, and -4 points, with a line for no change at zero.*
FDA Label Image

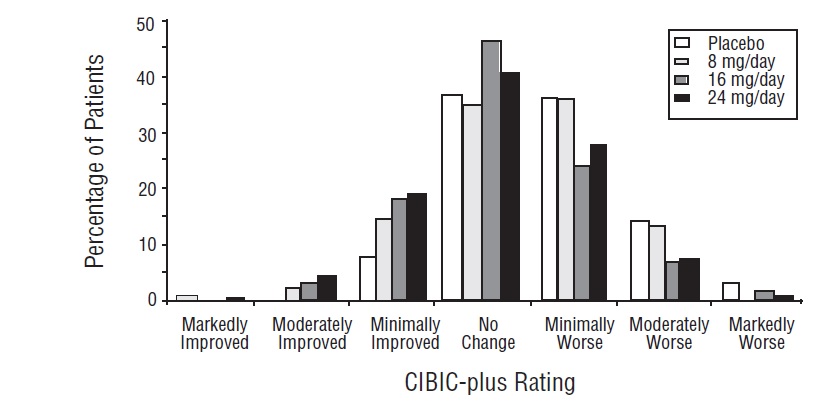
Figure 3: Distribution Of Cibic-plus Ratings At Week 21 (Galantamine Fig3)

Figure 3: Distribution Of Cibic-plus Ratings At Week 21 (Galantamine Fig3)
A bar chart depicting the percentage of patients across different CIBIC-plus Rating categories (Markedly Improved to Markedly Worse) for placebo and three Galantamine daily doses: 8 mg, 16 mg, and 24 mg. The chart shows patient distribution with variation in improvement and worsening statuses by treatment group.*
FDA Label Image

Figure 4: Time-course Of The Change From Baseline In Adas-cog Score For Patients Completing 26 Weeks Of Treatment (Galantamine Fig4)

Figure 4:	Time-course Of The Change From Baseline In Adas-cog Score For Patients Completing 26 Weeks Of Treatment (Galantamine Fig4)
A line graph showing mean change from baseline in ADAS-cog score over 26 weeks of treatment. The graph compares placebo, 24 mg/day, and 32 mg/day dosages, depicting improvement or decline in cognitive function scores over time with error bars representing standard error.*
FDA Label Image

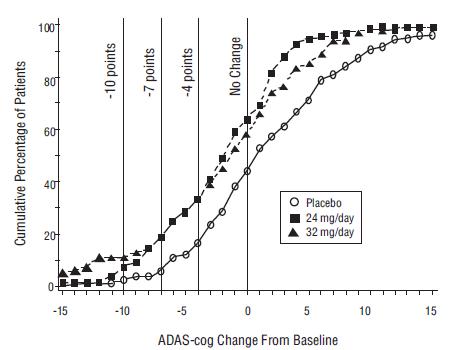
Figure 5 (Galantamine Fig5)

Figure 5 (Galantamine Fig5)
A cumulative distribution graph showing the percentage of patients versus ADAS-cog change from baseline. The graph compares three groups: Placebo, 24 mg/day, and 32 mg/day dosages. Vertical lines indicate -10, -7, and -4 point changes and a 'No Change' line at zero on the x-axis.*
FDA Label Image

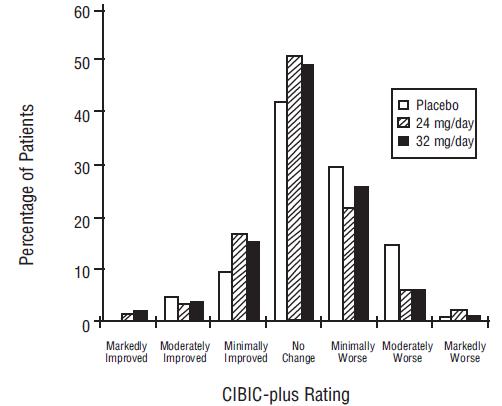
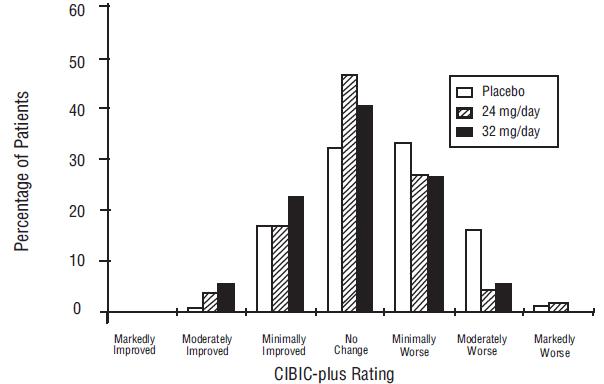
Figure 6: Distribution Of Cibic-plus Ratings At Week 26 (Galantamine Fig6)

Figure 6: Distribution Of Cibic-plus Ratings At Week 26 (Galantamine Fig6)
A bar chart depicting the distribution of patients based on CIBIC-plus ratings across three groups: Placebo, 24 mg/day, and 32 mg/day doses. The x-axis lists rating categories from Markedly Improved to Markedly Worse, while the y-axis shows the percentage of patients in each category.*
FDA Label Image

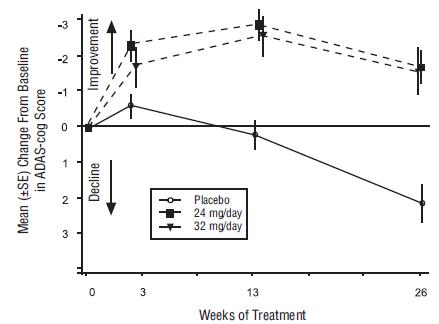
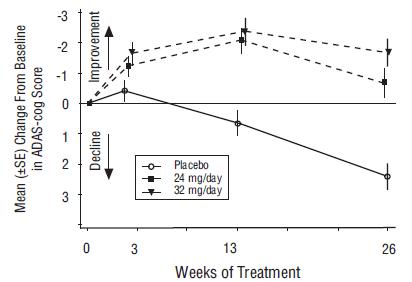
Figure 7: Time-course Of The Change From Baseline In Adas-cog Score For Patients Completing 26 Weeks Of Treatment (Galantamine Fig7)

Figure 7:         Time-course Of The Change From Baseline In Adas-cog Score For Patients Completing 26 Weeks Of Treatment (Galantamine Fig7)
A line graph showing mean change from baseline in ADAS-cog score over 26 weeks of treatment for three groups: placebo, 24 mg/day, and 32 mg/day. The y-axis represents mean change, with negative values indicating improvement and positive values indicating decline. Data points display trends of cognitive scores across weeks 0, 3, 13, and 26 of treatment.*
FDA Label Image

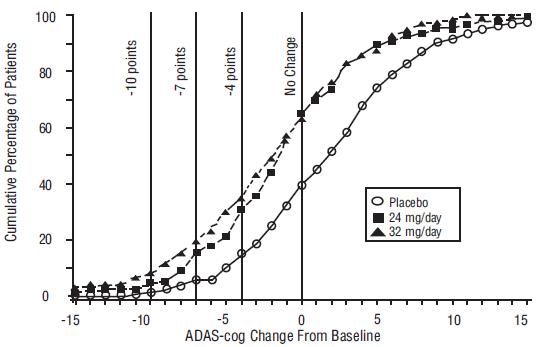
Figure 8: Cumulative Percentage Of Patients Completing 26 Weeks Of Double-blind Treatment With Specified Changes From Baseline In Adas-cog Scores. The Percentages Of Randomized Patients Who Completed The Study Were: Placebo 87%, 24 mg/day 80%, And 32 mg/day 75%. (Galantamine Fig8)

Figure 8:	Cumulative Percentage Of Patients Completing 26 Weeks Of Double-blind Treatment With Specified Changes From Baseline In Adas-cog Scores. The Percentages Of Randomized Patients Who Completed The Study Were: Placebo 87%, 24 mg/day 80%, And 32 mg/day 75%. (Galantamine Fig8)
A line graph showing the cumulative percentage of patients versus ADAS-cog change from baseline. The graph compares three groups: placebo, 24 mg/day, and 32 mg/day dosages, illustrating the cognitive changes over a range from -15 to 15 points.*
FDA Label Image

Figure 9: Distribution Of Cibic-plus Rating At Week 26 (Galantamine Fig9)

Figure 9:	Distribution Of Cibic-plus Rating At Week 26 (Galantamine Fig9)
A bar chart showing patient distribution across categories of CGI-plus Rating for Galantamine treatment groups versus placebo. The x-axis lists rating categories from Markedly Improved to Markedly Worse. The y-axis shows the percentage of patients. Three data series are displayed: Placebo, 24 mg/day, and 32 mg/day. Most patients fall under 'No Change' or nearby categories across all groups.*
FDA Label Image

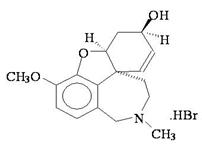
Chemical Structure (Galantamine Str)

Chemical Structure (Galantamine Str)
Chemical structure of galantamine hydrobromide, depicted as a skeletal formula including a methoxy-substituted benzene ring fused to a bicyclic system with nitrogen and hydroxyl groups.*

* About these descriptions: Image descriptions on this page are generated by automated AI analysis of the product label images from the manufacturer's FDA label submission (SPL). They are provided for reference only and may contain errors or omissions. Always rely on the printed label itself and the official FDA labeling, and consult a pharmacist or healthcare professional with any questions about this product.