Figure 1: Change In Height (cm) From Randomization Visit By Scheduled Week (treatment Group Mean ± Standard (Montelukast Fig1)
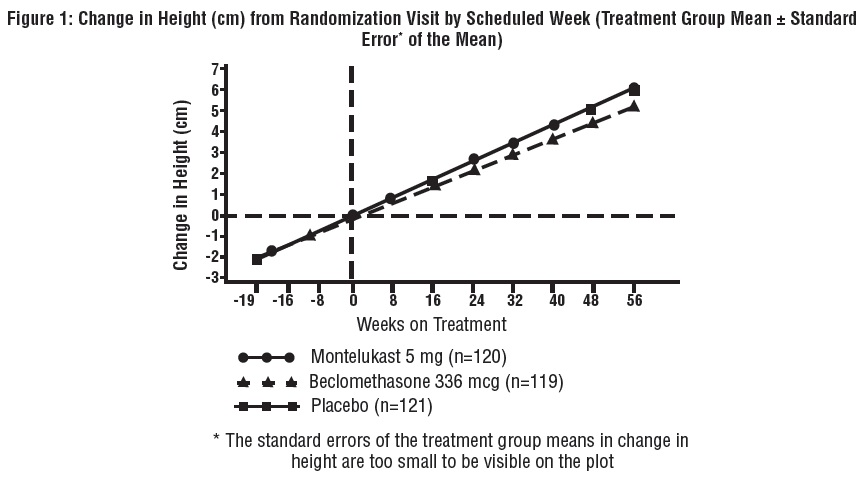
The text describes a figure (Figure 1) that shows the change in height (measured in centimeters) over a period of time (from 0 to 56 weeks) for three different treatment groups: Montelukast 5mg (n=120), Beclomethasone 336 mg (n=119), and Placebo (n=121). The mean change in height and standard error of the mean for each group is displayed on the plot. The text also notes that the standard errors of the treatment group means in change in height are too small to be visible on the plot.*