Irbesartan And Hydrochlorothiazide Tablet, Film Coated
Product Images NDC 65862-629

11 FDA label images from Aurobindo Pharma Limited · Packaging, Regulatory Labels, and Product Appearance

Product Visual Gallery

This gallery contains 11 technical images submitted to the FDA as part of the official labeling for Irbesartan And Hydrochlorothiazide (NDC 65862-629). Unlike standard consumer photos, these assets often include clinical data figures, molecular chemical structures, and official manufacturer packaging layouts.

As provided by Aurobindo Pharma Limited, these visuals offer a comprehensive scientific overview of the product's physical and chemical identity, aiding pharmacists and researchers in product verification and study.

FDA Label Image

Figure 1a: Probability Of Achieving Sbp <140 Mmhg In Patients From Initial Therapy Studies V (week 8) And Vi (week 7)* (Irbehctz Fig1)
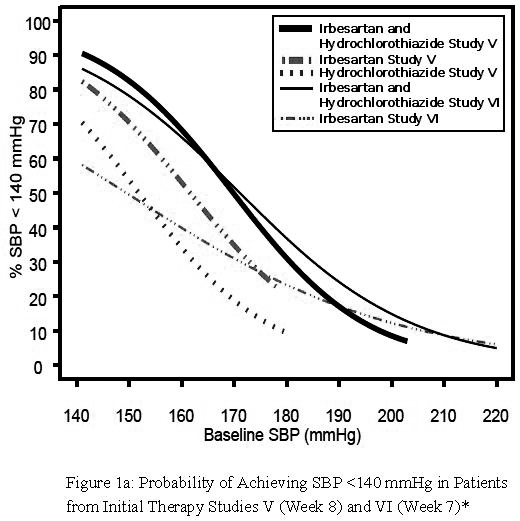
Figure 1a: Probability Of Achieving Sbp <140 Mmhg In Patients From Initial Therapy Studies V (week 8) And Vi (week 7)* (Irbehctz Fig1)
A line graph showing the probability of achieving systolic blood pressure (SBP) below 140 mmHg based on baseline SBP in mmHg. The graph compares results from two studies (V and VI) for three groups: Irbesartan and Hydrochlorothiazide combination, Irbesartan alone, and Hydrochlorothiazide alone. The y-axis represents the percentage of patients with SBP under 140 mmHg, and the x-axis shows baseline SBP values ranging from 140 to 220 mmHg.*
FDA Label Image

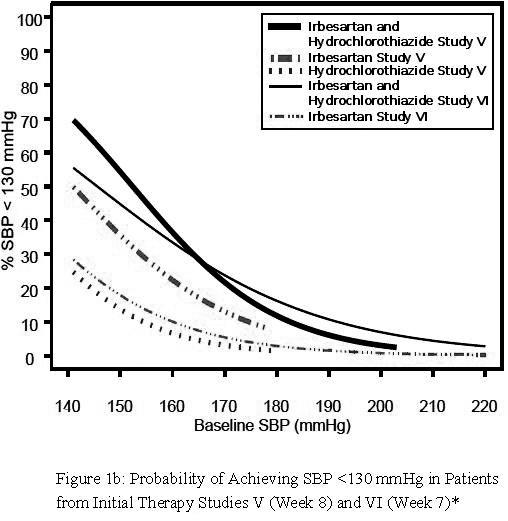
Figure 1b: Probability Of Achieving Sbp <130 Mmhg In Patients From Initial Therapy Studies V (week 8) And Vi (week 7)* (Irbehctz Fig2)

Figure 1b: Probability Of Achieving Sbp <130 Mmhg In Patients From Initial Therapy Studies V (week 8) And Vi (week 7)* (Irbehctz Fig2)
A line graph showing the probability of achieving systolic blood pressure (SBP) below 130 mmHg relative to baseline SBP in mmHg. The graph compares results from studies V and VI for treatments including Irbesartan and Hydrochlorothiazide combined, and each drug individually. The y-axis represents the percentage of patients achieving SBP <130 mmHg, and the x-axis shows baseline SBP values ranging from 140 to 220 mmHg.*
FDA Label Image

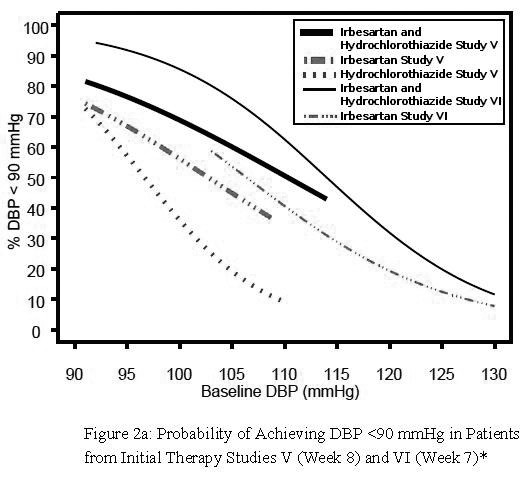
Figure 2a: Probability Of Achieving Dbp &lt;90 Mmhg In Patients From Initial Therapy Studies V (week 8) And Vi (week 7)* (Irbehctz Fig3)

Figure 2a: Probability Of Achieving Dbp &lt;90 Mmhg In Patients From Initial Therapy Studies V (week 8) And Vi (week 7)* (Irbehctz Fig3)
A line graph showing the probability of achieving diastolic blood pressure (DBP) less than 90 mmHg in patients from Initial Therapy Studies V (Week 8) and VI (Week 7). The x-axis represents baseline DBP (mmHg) ranging from 90 to 130, and the y-axis represents the percentage achieving DBP < 90 mmHg from 0 to 100%. Multiple lines indicate different study groups, including Irbesartan and Hydrochlorothiazide, Irbesartan, and Hydrochlorothiazide studies for both Study V and VI.*
FDA Label Image

Figure 2b: Probability Of Achieving Dbp &lt;80 Mmhg In Patients From Initial Therapy Studies V (week 8) And Vi (week7)* (Irbehctz Fig4)

Figure 2b: Probability Of Achieving Dbp &lt;80 Mmhg In Patients From Initial Therapy Studies V (week 8) And Vi (week7)* (Irbehctz Fig4)
A line graph showing the probability of achieving diastolic blood pressure (DBP) less than 80 mmHg in patients from Initial Therapy Studies V (Week 8) and VI (Week 7). The x-axis represents baseline DBP in mmHg (90 to 130), and the y-axis represents the percentage achieving DBP <80 mmHg (0% to 100%). Several lines compare Irbesartan and Hydrochlorothiazide combined versus individual components across the two studies.*
FDA Label Image

Figure 3. Placebo-subtracted Reduction In Through Sesbp; Integrated Analysis (Irbehctz Fig5)

Figure 3. Placebo-subtracted Reduction In Through Sesbp; Integrated Analysis (Irbehctz Fig5)
A line graph depicting the relationship between Irbesartan dose (mg/day) on the x-axis and mmHg reduction on the y-axis. Data points show variability around the curve, illustrating a plateauing reduction effect as doses increase up to approximately 900 mg/day.*
FDA Label Image

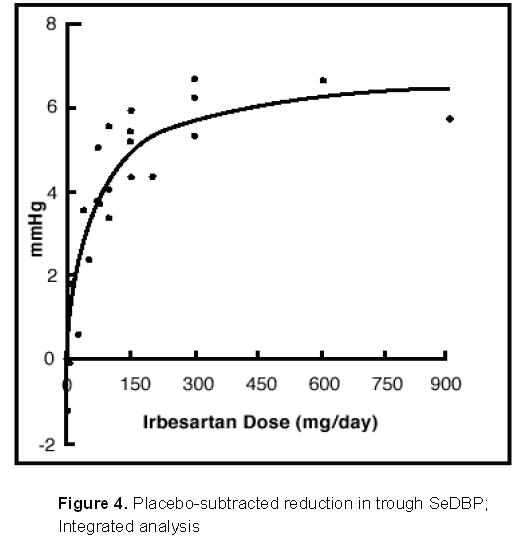
Figure 4. Placebo-subtracted Reduction In Through Sedbp; Integrated Analysis (Irbehctz Fig6)

Figure 4. Placebo-subtracted Reduction In Through Sedbp; Integrated Analysis (Irbehctz Fig6)
A line graph showing the relationship between Irbesartan dose (mg/day) on the x-axis and the reduction in trough SeDBP (mmHg) on the y-axis. The graph features scattered data points and a fitted curve indicating an increasing dose-response effect leveling off at higher doses, based on integrated analysis.*
FDA Label Image

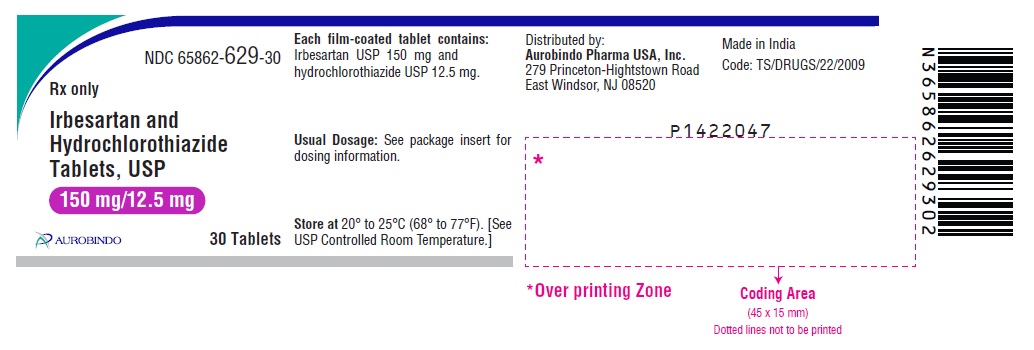
Package Label-principal Display Panel (150 mg/12.5 mg (30 Tablets Bottle))

Package Label-principal Display Panel (150 mg/12.5 mg (30 Tablets Bottle))
Label for Irbesartan and Hydrochlorothiazide Tablets, USP 150 mg/12.5 mg film-coated tablets by Aurobindo Pharma Limited. The label indicates a package size of 30 tablets, includes storage instructions at 20° to 25°C, and notes the product is made in India and distributed by Aurobindo Pharma USA, Inc. A barcode and NDC 65862-629-30 are also displayed.*
FDA Label Image

Package Label-principal Display Panel (300 mg/12.5 mg (30 Tablets Bottle))

Package Label-principal Display Panel (300 mg/12.5 mg (30 Tablets Bottle))
Label for Irbesartan and Hydrochlorothiazide Tablets, USP 300 mg/12.5 mg film-coated tablets. The label indicates the product is distributed by Aurobindo Pharma USA, Inc. and manufactured in India. It contains 30 tablets per package and includes storage instructions and a barcode.*
FDA Label Image

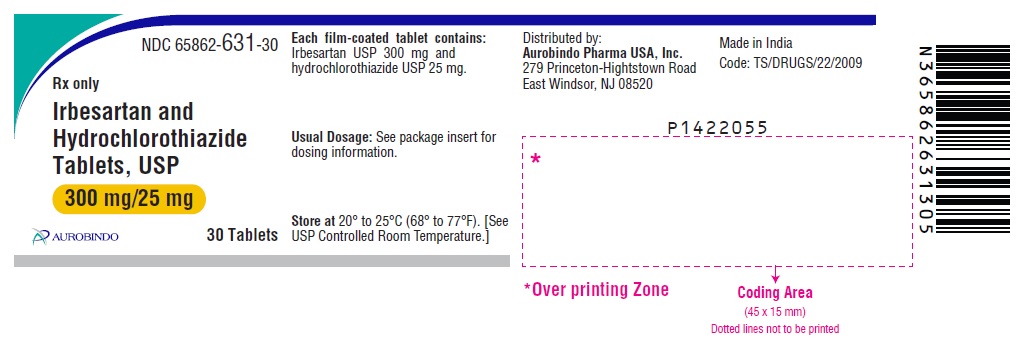
Package Label-principal Display Panel (300 mg/25 mg (30 Tablets Bottle))

Package Label-principal Display Panel (300 mg/25 mg (30 Tablets Bottle))
Label for Irbesartan and Hydrochlorothiazide Tablets, USP 300 mg/25 mg film-coated tablets. The label indicates 30 tablets per package, distributed by Aurobindo Pharma USA, Inc., and manufactured in India by Aurobindo Pharma Limited. The label includes storage instructions and a barcode on the right side.*
FDA Label Image

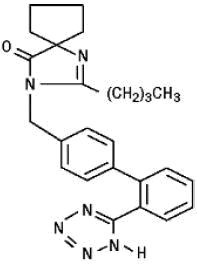
Chemical Structure (Irbehctz Str1)

Chemical Structure (Irbehctz Str1)
Chemical structure of Irbesartan, one of the active ingredients in the Irbesartan and Hydrochlorothiazide film-coated tablet product by Aurobindo Pharma Limited.*
FDA Label Image

Chemical Structure (Irbehctz Str2)

Chemical Structure (Irbehctz Str2)
Chemical structure of Irbesartan, showing the molecular arrangement of atoms including chlorine, nitrogen, oxygen, and sulfur. The diagram depicts bonds and functional groups characteristic of this active ingredient.*

* About these descriptions: Image descriptions on this page are generated by automated AI analysis of the product label images from the manufacturer's FDA label submission (SPL). They are provided for reference only and may contain errors or omissions. Always rely on the printed label itself and the official FDA labeling, and consult a pharmacist or healthcare professional with any questions about this product.