Figure 1 (Finasteride Fig1)
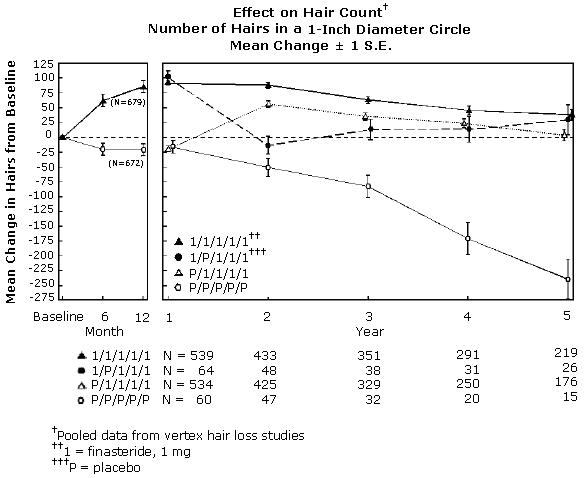
This is data from a hair loss study, comparing the mean change in the number of hairs in a 1-inch diameter circle for a group using finasteride (1mg) versus one using placebo. The data shows the change in the number of hairs over a span of 6 months, from January to June. The results are presented in a table, with each row representing a different month, and each column representing a different group treatment. The mean change in the number of hairs is measured and represented in a graphical format.*