Product Images Sildenafil

View Photos of Packaging, Labels & Appearance

Product Label Images

The following 9 images provide visual information about the product associated with Sildenafil NDC 65862-688 by Aurobindo Pharma Limited, such as packaging, labeling, and the appearance of the drug itself. This resource could be helpful for medical professionals, pharmacists, and patients seeking to verify medication information and ensure they have the correct product.

Figure 6: Kaplan-Meier Plot of Mortality by Sildenafil Dose - sildenafil fig1

Figure 6: Kaplan-Meier Plot of Mortality by Sildenafil Dose - sildenafil fig1

This table shows the estimated cumulative mortality rate in percentage for different doses and time periods. The three doses are High, Medium, and Low, with corresponding values for each dose at different time intervals.*

Figure 7. Effects of Other Drugs on Sildenafil Pharmacokinetics - sildenafil fig2

Figure 7. Effects of Other Drugs on Sildenafil Pharmacokinetics - sildenafil fig2

This document provides information on the recommended drug fold change and 90% C1 Recommendation for several drugs such as Aorvastatin, Aithromycin®, Bosentan, Cimetidine*, Enthromycin®, Maalox®, Oral Contraeptives™*, Ritonavir, and Saquinavir. The AUC, Cmax, and dose adjustment for each drug are mentioned. There is also a graph that shows the change relative to Sildenatil alone with a vertical solid line. Additionally, there is a note mentioning that there is no benefit on exercise capacity when sildenafil is added to bosentan therapy.*

Figure 8 Effects of Sildenafil on Other Drugs - sildenafil fig3

Figure 8 Effects of Sildenafil on Other Drugs - sildenafil fig3

This appears to be a list of drugs and their potential interactions with Acenocoumarol. The table contains information regarding the effects of the drugs on INR AUC, INR Cmax, BT, AU, Cmax, and AUC, and includes a recommendation of whether a dose adjustment is necessary. There is also a footnote regarding the effect of ritonavir on sildenafil PK.*

Figure 9. Change from Baseline in 6-Minute Walk Distance (meters) at Weeks 4, 8, and 12 in Study 1: Mean (95% Confidence Interval) - sildenafil fig4

Figure 9.  Change from Baseline in 6-Minute Walk Distance (meters) at Weeks 4, 8, and 12 in Study 1: Mean (95% Confidence Interval) - sildenafil fig4

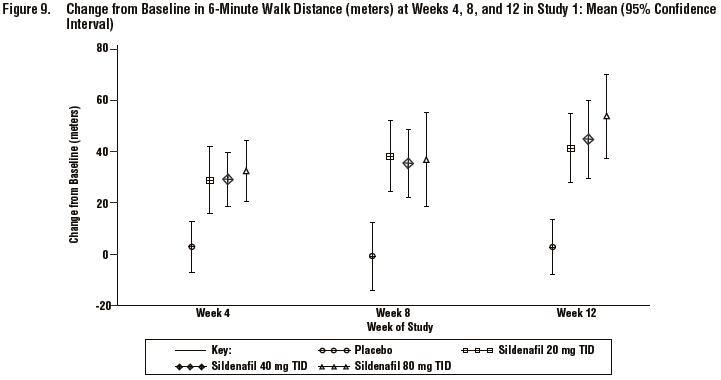
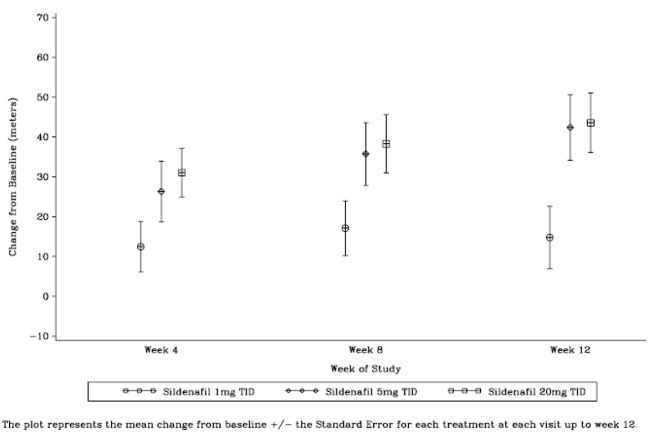
The text appears to be an excerpt from a clinical study report presenting a chart (Figure 0) that displays the change from baseline in 6-minute walk distance in meters at weeks 4, 8, and 12 of Study 1 for different treatments: placebo, sildenafil 40mg TID, and sildenafil 80mg TID. The chart shows mean values and 95% confidence intervals for the different timepoints and treatments. Therefore, a possible description would be: "Figure 0 displays the change from baseline in 6-minute walk distance in meters for different treatments at weeks 4, 8, and 12 of Study 1. The chart shows the mean values and 95% confidence intervals for placebo, sildenafil 40mg TID, and sildenafil 80mg TID. However, no further information is available since the text does not provide more context, such as the aims of the study, its design, or its results.*

Figure 10. Placebo-Corrected Change From Baseline in 6-Minute Walk Distance (meters) at Week 12 by study subpopulation in Study 1: Mean (95% Confidence Interval) - sildenafil fig5

Figure 10.  Placebo-Corrected Change From Baseline in 6-Minute Walk Distance (meters) at Week 12 by study subpopulation in Study 1: Mean (95% Confidence Interval) - sildenafil fig5

The text describes a figure, specifically the Placebo-Corrected Change From Baseline in 6-Minute Walk Distance (measured in meters) chart on the Week 12 study subpopulation for Study 1. The data in the chart is grouped by subpopulation including IdiopathicPAH, Etiology PHCD, PAH-surgical repair, and PH eiteia for functional capacity Cemlll & therapeutic class. It provides data related to N, baseline walk distance, and mean values including age, mean pulmonary arterial pressure (PAP), and pulmonary resistance (PR). The chart shows the change in 6-minute walk distance for Placebo against Sildenafil and Sidenaf 20 mg TID.*

Figure 11. Kaplan-Meier Plot of Time (in Days) to Clinical Worsening of PAH in Study 2 - sildenafil fig6

Figure 11. Kaplan-Meier Plot of Time (in Days) to Clinical Worsening of PAH in Study 2 - sildenafil fig6

This is a Kaplan-Meier plot depicting the time (in days) taken for clinical worsening of Pulmonary Arterial Hypertension (PAH) in Study 2. The plot shows the percentage of patients who did not experience a clinically worsening event depicted against time. The two treatments compared are Placebo and Sildenafil. The x-axis depicts the duration in days from randomization.*

Figure 12. Mean Change from Baseline in Six Minute Walk (meters) by Visit to Week 12 – ITT Population Sildenafil Protocol A1481244 - sildenafil fig7

Figure 12. Mean Change from Baseline in Six Minute Walk (meters) by Visit to Week 12 – ITT Population Sildenafil Protocol A1481244 - sildenafil fig7

figure 8 - sildenafil fig8

figure 8 - sildenafil fig8

Each tablet of Sildenafil contains 20 mg of Sildenafil citrate USP equivalent to Sildenafil. The normal dosage should be seen from the accompanying Rx prescribing information. They should be stored in tight containers in a controlled room temperature of 20° to 25°C. These tablets were made in India by AUROBINDO. The batch and expiry dates will be printed during the coding process; dotted lines should not be printed.*

Chemical Structure - sildenafil str

Chemical Structure - sildenafil str

* The product label images have been analyzed using a combination of traditional computing and machine learning techniques. It should be noted that the descriptions provided may not be entirely accurate as they are experimental in nature. Use the information in this page at your own discretion and risk.