Rabeprazole Sodium Tablet, Delayed Release
Product Images NDC 65862-721

View Photos of Packaging, Regulatory Labels, and Product Appearance

Product Visual Gallery

This gallery contains 6 technical images submitted to the FDA as part of the official labeling for Rabeprazole Sodium (NDC 65862-721). Unlike standard consumer photos, these assets often include clinical data figures, molecular chemical structures, and official manufacturer packaging layouts.

As provided by Aurobindo Pharma Limited, these visuals offer a comprehensive scientific overview of the product's physical and chemical identity, aiding pharmacists and researchers in product verification and study.

FDA Label Image

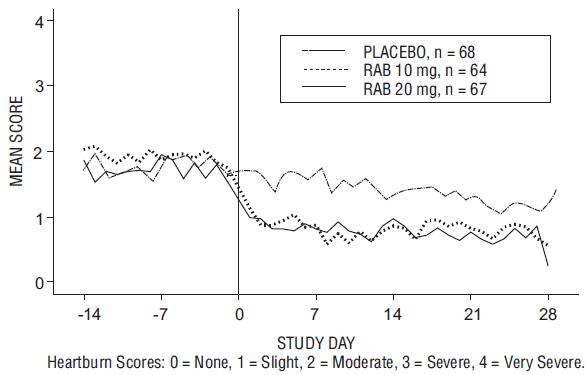
Rabeprazole Fig1

Rabeprazole Fig1
A line graph depicting mean heartburn scores over a 28-day study period for three groups: placebo, Rabeprazole 10 mg, and Rabeprazole 20 mg. The x-axis shows study days from -14 to 28, and the y-axis shows heartburn scores ranging from 0 (None) to 4 (Very Severe). The graph illustrates the trend in heartburn symptom severity before and after day 0, the start of treatment.*
FDA Label Image

Figure 2: Mean Daytime Heartburn Scores Rab-usa-2 (Rabeprazole Fig2)

Figure 2: Mean Daytime Heartburn Scores Rab-usa-2 (Rabeprazole Fig2)
A line graph depicting mean heartburn scores over study days for three groups: placebo, Rabeprazole 10 mg, and Rabeprazole 20 mg. The x-axis shows study days from -14 to 28, and the y-axis shows mean scores from 0 (none) to 4 (very severe). The graph illustrates changes in heartburn severity before and after treatment initiation at day 0.*
FDA Label Image

Figure 3: Mean Nighttime Heartburn Scores Rab-usa-2 (Rabeprazole Fig3)

Figure 3: Mean Nighttime Heartburn Scores Rab-usa-2 (Rabeprazole Fig3)
A line graph comparing mean heartburn scores over study days for two groups: placebo and Rabeprazole Sodium (RAB) 20 mg. The x-axis represents study days from -14 to 28, and the y-axis shows mean scores from 0 (none) to 4 (very severe). The graph shows a decrease in mean scores for the RAB 20 mg group post day 0 compared to placebo.*
FDA Label Image

Figure 4: Mean Daytime Heartburn Scores Rab-usa-3 (Rabeprazole Fig4)

Figure 4: Mean Daytime Heartburn Scores Rab-usa-3 (Rabeprazole Fig4)
Line graph comparing mean heartburn scores over 28 study days between a placebo group (n=58) and a Rabeprazole Sodium 20 mg group (n=59). The y-axis shows mean heartburn scores from 0 (None) to 4 (Very Severe), and the x-axis represents study days from -14 to 28. Scores decrease after day 0, with the Rabeprazole group showing a consistently lower mean score than placebo.*
FDA Label Image

Figure 5: Mean Nighttime Heartburn Scores Rab-usa-3 (Rabeprazole Fig5)

Figure 5: Mean Nighttime Heartburn Scores Rab-usa-3 (Rabeprazole Fig5)
Label for Rabeprazole Sodium delayed-release tablets, 20 mg strength, packaged as 30 tablets. The label includes storage instructions (store at 20° to 25°C) and dispensing guidance. Distributed by Aurobindo Pharma USA, Inc., made in India, with a barcode visible on the right side. The label features Aurobindo branding and color codes at the bottom.*
FDA Label Image

Chemical Structure (Rabeprazole Str)

Chemical Structure (Rabeprazole Str)
Chemical structure of Rabeprazole Sodium, showing its molecular framework including sulfur, nitrogen, oxygen, and sodium atoms as part of the compound's arrangement.*

* About these descriptions: Image descriptions on this page are generated by automated AI analysis of the product label images from the manufacturer's FDA label submission (SPL). They are provided for reference only and may contain errors or omissions. Always rely on the printed label itself and the official FDA labeling, and consult a pharmacist or healthcare professional with any questions about this product.