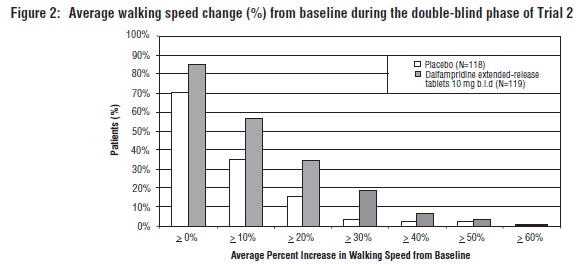
Figure 1 (Dalfampridine Fig1)
This is a description of the results obtained from study/trial number 1, in which the average change in walking speed was measured during a double-blind phase. The data is presented in Figure 1 as a graph that shows the average percent increase in walking speed from baseline. The placebo group, consisting of 72 participants, is represented by the "0%" bar. The "D st tables 10 mg b.id" group, consisting of 224 participants, is represented by the "%" bars ranging from 20-60%.*