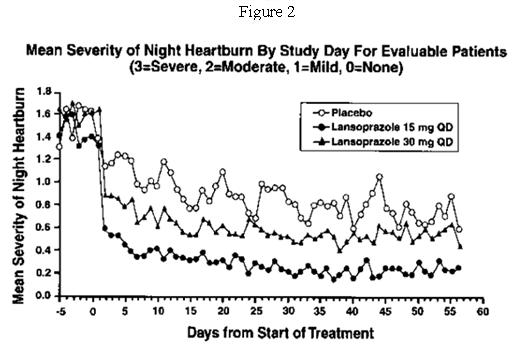
Figure1 (Lansoprazole Fig1)

This is a graph with three lines representing the average severity of heartburn experienced by patients, measured on a scale of 0 (none) to 3 (severe), over time (in days) for three different groups: a placebo group, a group taking 15 mg of lansoprazole once a day, and a group taking 30 mg of lansoprazole once a day. The x-axis represents the days from the start of treatment and the y-axis represents the severity of heartburn.*