Figure 1. Circulatory Disease Mortality Rates Per 100,000 Women-years By Age, Smoking Status And Oral Contraceptive Use (Norethindrone Fig1)
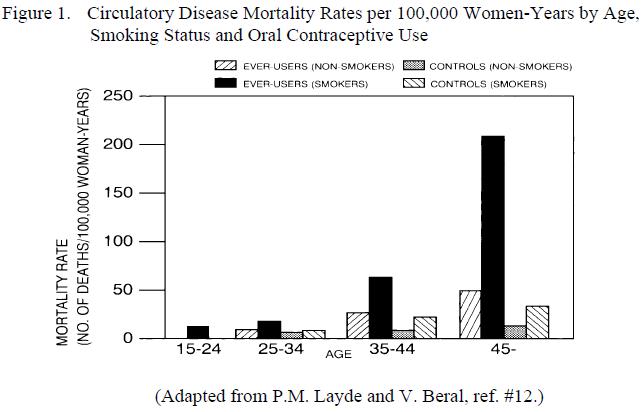
The text is a figure showing Circulatory Disease Mortality Rates per 100,000 Women-Years by Age, Smoking Status, and Oral Contraceptive Use. There are four groups represented in the figure: ever-users, non-smokers, and smokers, both of which have control groups. The mortality rate is shown on the Y-axis, with values ranging from 0 to 250. The X-axis represents age groups. The figure is adapted from a reference by P.M. Layde and V. Beral.*