Figure1 (Norethindroneethinyl Fig1)
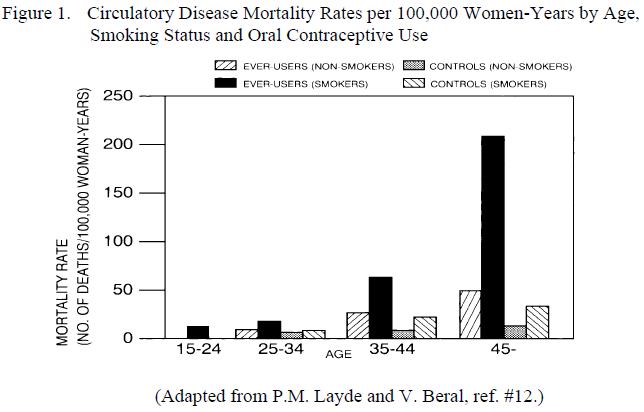
The text describes a figure depicting circulatory disease mortality rates by age, smoking status and oral contraceptive use. The figure shows mortality rates per 100,000 women-years and includes groups of smokers and non-smokers who have ever used oral contraceptives and controls who have not. The mortality rates vary by age group, with higher rates for older women. The source reference of the figure is mentioned.*