Figure 3 (Ipratropiumalbuterol Fig1)
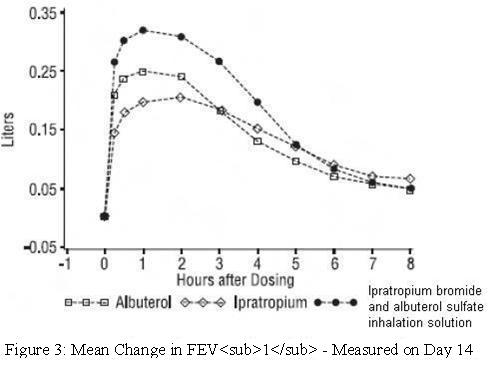
The text describes a chart or graph showing the mean change in FEV1 (forced expiratory volume) measured on day 14 after dosing with a combination of ipratropium bromide, albuterol, and albuterol sulfate inhalation solution. The chart displays the hour intervals after dosing along the x-axis from 1 to 8 and the change in FEV1 on the y-axis from 0.05 to an undetermined value, measured in some unit.*