Namenda
Product Images NDC 67046-489

View Photos of Packaging, Regulatory Labels, and Product Appearance

Product Visual Gallery

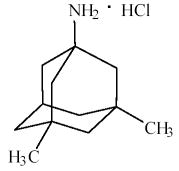
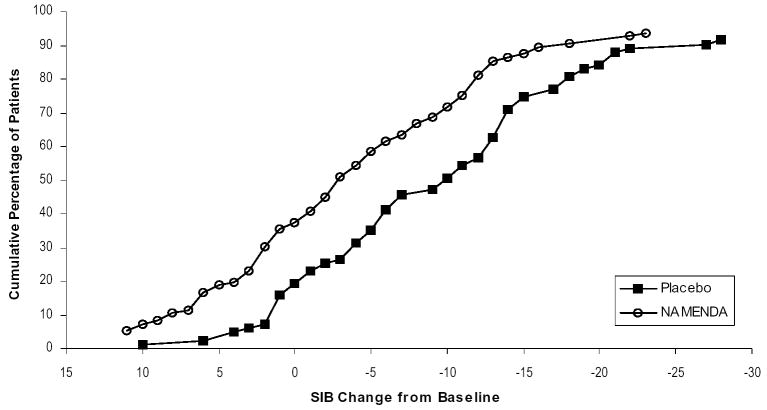
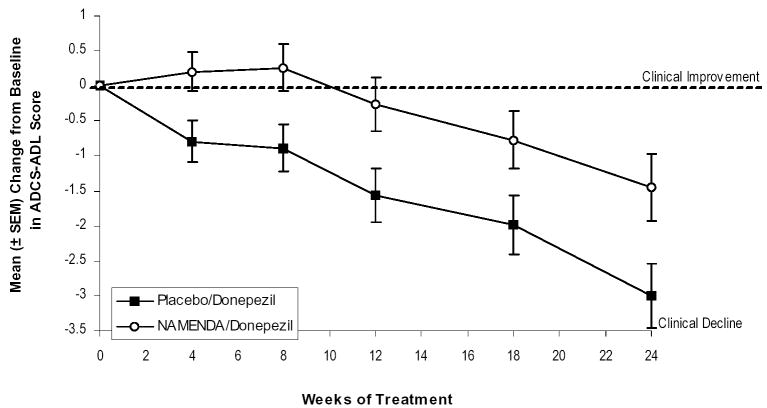
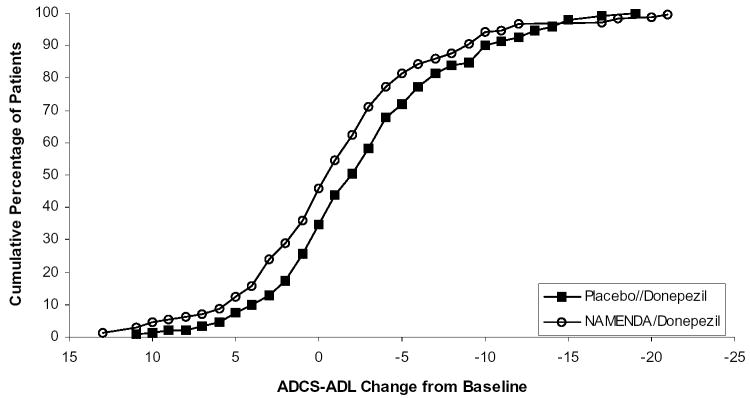
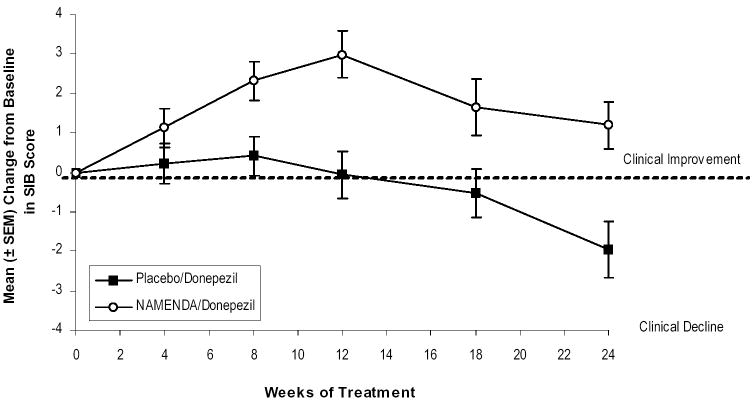
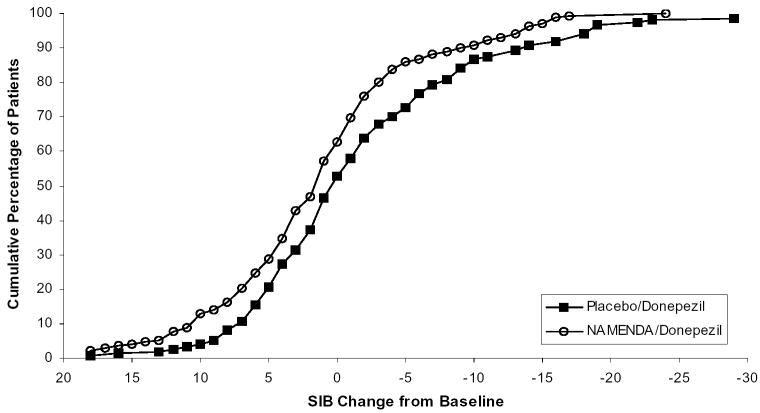
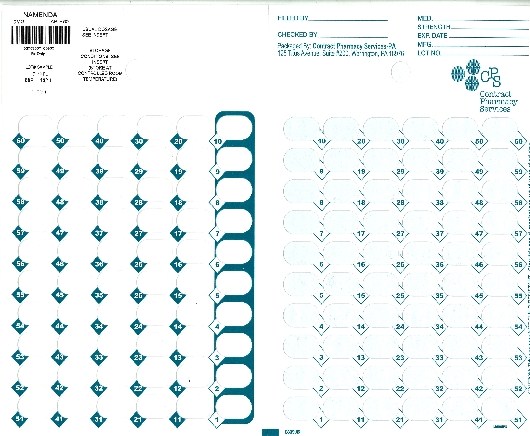
This gallery contains 10 technical images submitted to the FDA as part of the official labeling for Namenda (NDC 67046-489). Unlike standard consumer photos, these assets often include clinical data figures, molecular chemical structures, and official manufacturer packaging layouts.

As provided by Contract Pharmacy Services-pa, these visuals offer a comprehensive scientific overview of the product's physical and chemical identity, aiding pharmacists and researchers in product verification and study.

FDA Label Image

Image Of Namenda Chemical Structure (Bc6e059d 1951 4fa3 B904 230d4165724d 01)

FDA Label Image

Image Of Figure 1: Time Course Of Change Graph (Bc6e059d 1951 4fa3 B904 230d4165724d 02)

FDA Label Image

Image Of Figure 2: Cumalative Percentage Graph (Bc6e059d 1951 4fa3 B904 230d4165724d 03)

Image Of Figure 2: Cumalative Percentage Graph (Bc6e059d 1951 4fa3 B904 230d4165724d 03)
This appears to be a chart displaying the Cumulative Percentage of Patients for a Placebo and NAMENDA with respect to the ADCS-ADL Change from Baseline. The chart displays two lines, one labeled "Placebo" and the other labeled "NAMENDA". The x-axis displays the ADCS-ADL Change from Baseline values, while the y-axis the Cumulative Percentage of Patients. At ADCS-ADL Change from Baseline equal to -5, the Cumulative Percentage of Patients is about 5 for Placebo and 20 for NAMENDA. At ADCS-ADL Change from Baseline equal to 25, the Cumulative Percentage of Patients is about 10 for Placebo and almost 25 for NAMENDA.*
FDA Label Image

Image Of Figure 3: Time Course Of The Change Graph (Bc6e059d 1951 4fa3 B904 230d4165724d 04)

Image Of Figure 3: Time Course Of The Change Graph (Bc6e059d 1951 4fa3 B904 230d4165724d 04)
This is a chart displaying the "SIB Score" with mean change from baseline, over 12 and 16-weeks of treatment with Placebo and NAMENDA. The third row reads "Clinical Decline".*
FDA Label Image

Image Of Figure 4: Cumulative Percentage Graph (Bc6e059d 1951 4fa3 B904 230d4165724d 05)

Image Of Figure 4: Cumulative Percentage Graph (Bc6e059d 1951 4fa3 B904 230d4165724d 05)
The text appears to be a graph showing the "Cumulative Percentage of Patients" on the Y axis and "SIB Change from Baseline" on the X axis. There are two lines, one labeled "Placebo" and the other labeled "NAMENDA". The graph shows the percentage of patients and change from baseline for each treatment option.*
FDA Label Image

Image Of Figure 5: Time Course Of The Change Graph (Bc6e059d 1951 4fa3 B904 230d4165724d 06)

FDA Label Image

Image Of Figure 6: Cumulative Percentage Graph (Bc6e059d 1951 4fa3 B904 230d4165724d 07)

Image Of Figure 6: Cumulative Percentage Graph (Bc6e059d 1951 4fa3 B904 230d4165724d 07)
The text represents a graph showing the cumulative percentage of patients who experienced a certain change in ADCS-ADL (Alzheimer's Disease Cooperative Study-Activities of Daily Living) score from baseline. The patients were either given a placebo or donepezil, or NAVENDA (an unknown drug) in combination with donepezil. The graph shows the change in percentage over time (-20 to 25) and the difference in results between the two treatment groups.*
FDA Label Image

Image Of Figure 7: Time Course Of The Change Graph (Bc6e059d 1951 4fa3 B904 230d4165724d 08)

Image Of Figure 7: Time Course Of The Change Graph (Bc6e059d 1951 4fa3 B904 230d4165724d 08)
This appears to be a figure or chart without any accompanying text describing its content. Therefore, a useful description cannot be generated.*
FDA Label Image

Image Of Figure 8: Cumulative Percentage Graph (Bc6e059d 1951 4fa3 B904 230d4165724d 09)

Image Of Figure 8: Cumulative Percentage Graph (Bc6e059d 1951 4fa3 B904 230d4165724d 09)
This appears to be a graph comparing the effects of two different treatments (Placebo/Donepezil and Namenda/Donepezil) on patients, measured by their SIB (Severe Impairment Battery) change from baseline. The Y-axis represents the "Cumulative Percentage of Patients" while the X-axis represents the SIB change from baseline, in increments from -30 to 25. Without further context or information, it is not possible to assess the significance of the results or the purpose of the study.*
FDA Label Image

10 mg (Bc6e059d 1951 4fa3 B904 230d4165724d 10)

* These product label images have been analyzed using experimental machine learning. Please verify findings with the primary label text.