Bortezomib Injection, Powder, Lyophilized, For Solution
Product Images NDC 67184-0530

10 FDA label images from Qilu Pharmaceutical Co., Ltd. · Packaging, Regulatory Labels, and Product Appearance

Product Visual Gallery

This gallery contains 10 technical images submitted to the FDA as part of the official labeling for Bortezomib (NDC 67184-0530). Unlike standard consumer photos, these assets often include clinical data figures, molecular chemical structures, and official manufacturer packaging layouts.

As provided by Qilu Pharmaceutical Co., Ltd., these visuals offer a comprehensive scientific overview of the product's physical and chemical identity, aiding pharmacists and researchers in product verification and study.

FDA Label Image

Chemical Structure (Bortezomib 01)

Chemical Structure (Bortezomib 01)
Chemical structure of Bortezomib, showing its molecular arrangement with rings, amide groups, and boronic acid functional group as part of the active ingredient's structure.*
FDA Label Image

Figure 1 (Bortezomib 02)

Figure 1 (Bortezomib 02)
A Kaplan-Meier survival curve chart showing percentage of patients over time in months. The chart compares two groups labeled Vc-MP and MP, with Vc-MP represented by a red line and MP by a blue line. The x-axis is time in months (0 to 26), and the y-axis is percentage of patients (0 to 100). Below the graph is a table listing the number of patients at risk at various time points for each group, alongside a p-value from a log-rank test indicating statistical significance.*
FDA Label Image

Figure 2 (Bortezomib 03)

Figure 2 (Bortezomib 03)
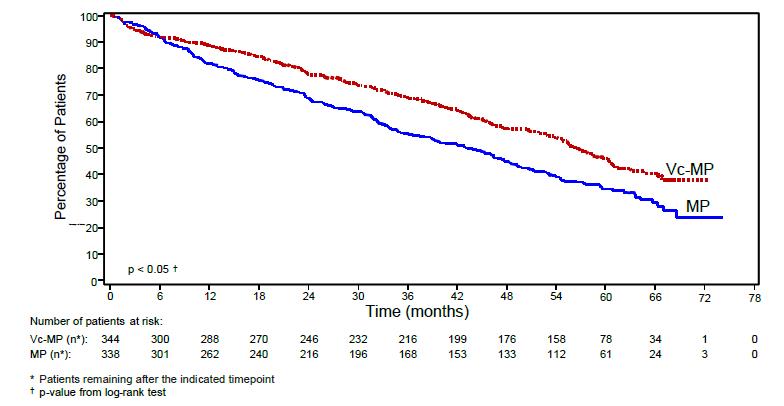
A Kaplan-Meier survival curve comparing two patient groups labeled Vc-MP and MP over time in months. The y-axis represents the percentage of patients, ranging from 0 to 100%, while the x-axis represents time up to 78 months. Vc-MP is shown with a red dashed line, while MP is shown with a solid blue line, indicating higher survival percentages in the Vc-MP group. The chart includes a table below showing the number of patients at risk at various time points and notes a p-value less than 0.05 from a log-rank test.*
FDA Label Image

Figure 3 (Bortezomib 04)

Figure 3 (Bortezomib 04)
A Kaplan-Meier survival curve comparing the proportion of patients over time (days) for Bortezomib and Dexamethasone. The graph shows patient survival decreasing over approximately 450 days, with Bortezomib group maintaining a higher proportion of patients compared to Dexamethasone. The chart includes the number of patients remaining at specified time points and the p-value from a log-rank test (<0.0001).*
FDA Label Image

Figure 4 (Bortezomib 05)

Figure 4 (Bortezomib 05)
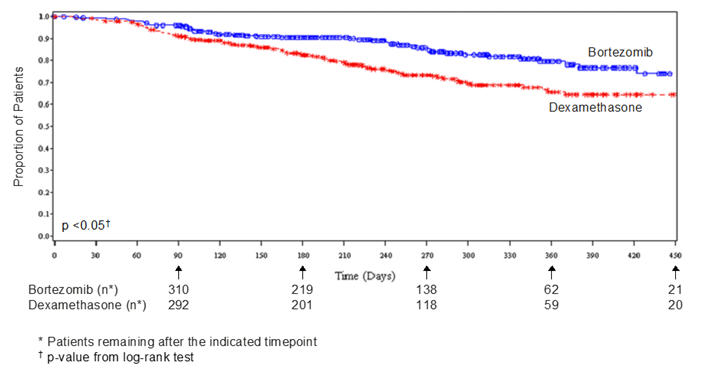
A line graph showing the proportion of patients over time in days comparing Bortezomib and Dexamethasone treatments. The graph indicates a higher patient proportion for Bortezomib (blue line) than Dexamethasone (red line) across 450 days, with p-value <0.05. Patient counts at various timepoints are listed below.*
FDA Label Image

Figure 5 (Bortezomib 06)

Figure 5 (Bortezomib 06)
A Kaplan-Meier survival curve comparing percentage of patients over time in months between two treatments, VcR-CAP and R-CHOP. The graph shows higher survival rates for VcR-CAP versus R-CHOP over a 60-month period, with a log rank test p-value less than 0.001. Below the x-axis, patient numbers at risk for each treatment group are listed across various time points.*
FDA Label Image

Figure 6 (Bortezomib 07)

Figure 6 (Bortezomib 07)
A Kaplan-Meier survival curve showing the percentage of subjects alive over months from randomization. Two groups, VcR-CAP and R-CHOP, are compared with VcR-CAP represented by a solid line and R-CHOP by a dashed line. The chart includes subjects at risk over time and a hazard ratio of 0.66 (95% CI: 0.51, 0.85).*
FDA Label Image

Principal Display Panel (3.5 mg Vial Label)

Principal Display Panel (3.5 mg Vial Label)
Label for Bortezomib injection 3.5 mg/vial, a single-dose lyophilized powder for intravenous or subcutaneous use by Qilu Pharmaceutical Co., Ltd. The label includes storage instructions, a caution as a cytotoxic agent, and manufacturer information from Haikou, China. It also shows NDC code 67184-0530-1 along with barcode and placeholders for lot and expiration dates.*
FDA Label Image

Principal Display Panel (3.5 mg Vial Carton)

Principal Display Panel (3.5 mg Vial Carton)
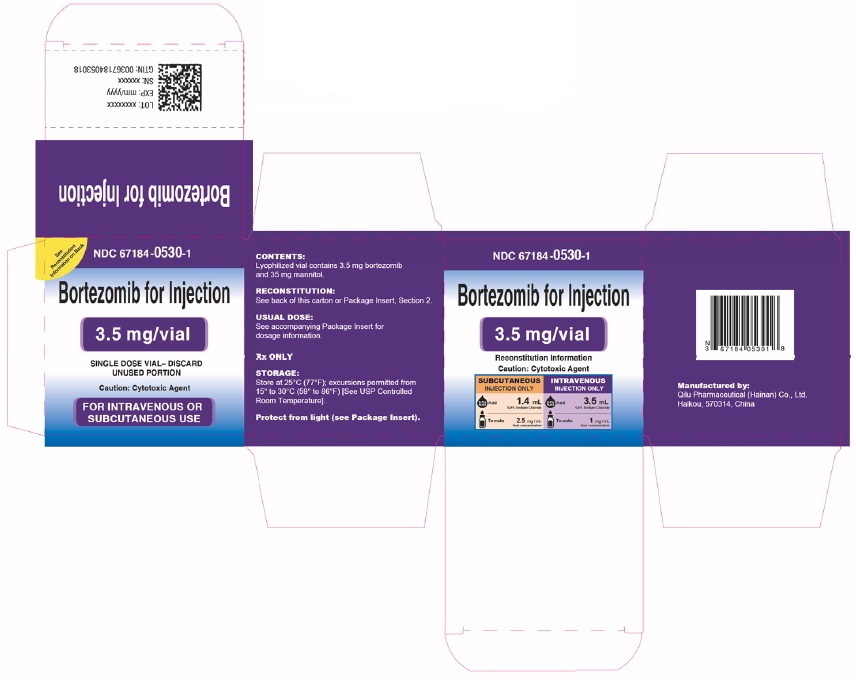
Packaging label for Bortezomib for Injection, 3.5 mg per vial, a lyophilized powder for intravenous or subcutaneous use. The label states single dose vial with instructions to discard unused portions. Manufactured by Qilu Pharmaceutical Co., Ltd., Haikou, China, it includes storage directions and cautions for this cytotoxic agent. Reconstitution information with dosage for subcutaneous (1.4 mL) and intravenous (3.5 mL) injections is shown, alongside a barcode and NDC 67184-0530-1.*
FDA Label Image

Principal Display Panel Inside Flap (all Cartons) (Bortezomib 10)

Principal Display Panel Inside Flap (all Cartons) (Bortezomib 10)
The image shows a blank unfolded carton with a highlighted label panel providing reconstitution information for Bortezomib injection. It details dilution instructions for subcutaneous (1.4 mL 0.9% sodium chloride solution to make 2.5 mg/mL) and intravenous (3.5 mL 0.9% sodium chloride solution to make 1 mg/mL) administration routes.*

* About these descriptions: Image descriptions on this page are generated by automated AI analysis of the product label images from the manufacturer's FDA label submission (SPL). They are provided for reference only and may contain errors or omissions. Always rely on the printed label itself and the official FDA labeling, and consult a pharmacist or healthcare professional with any questions about this product.