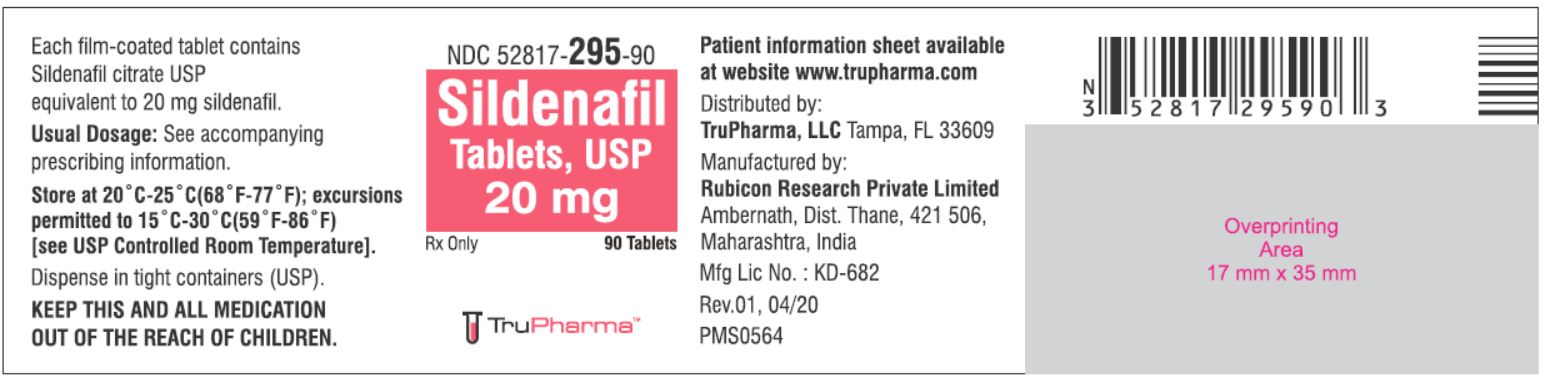
Principal Display Panel (20 mg Tablet Bottle Label)
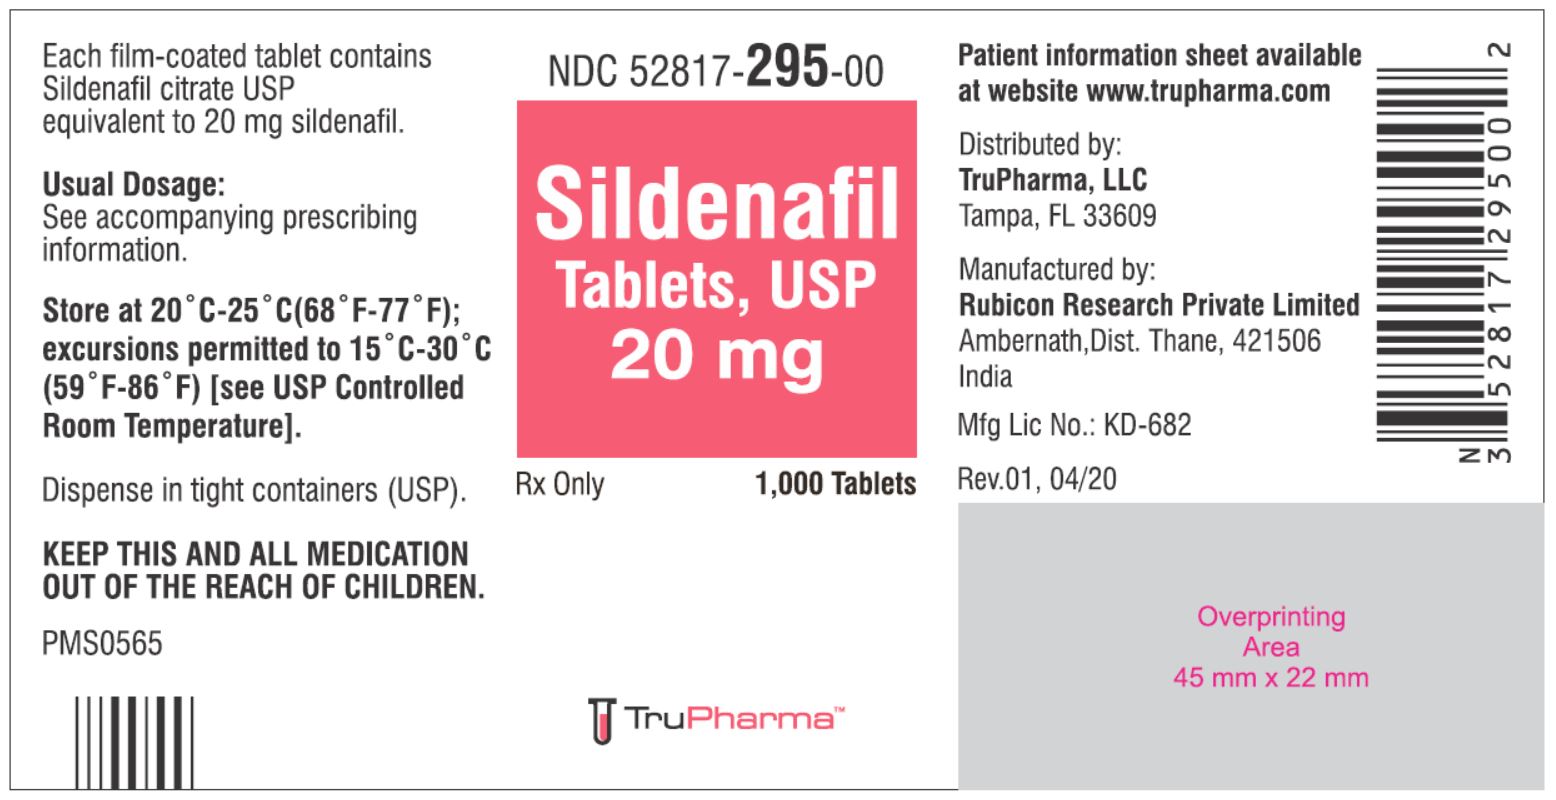
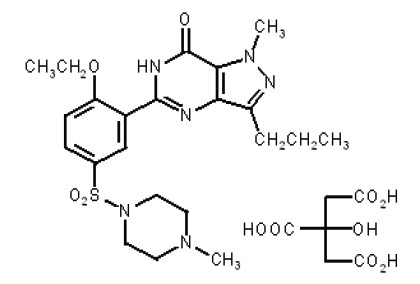
This is a medication called Sildenafil citrate, which comes in the form of film-coated tablets containing 20 mg of sildenafil. It is meant to be taken according to the prescribing doctor's instructions and stored between the temperatures of 20°C-25°C (68°F-77°F), with excursions permitted to 15°C-30°C (59°F-86°F). The tablets should be dispensed in tight containers, kept away from children and the patient information sheet can be obtained from the website mentioned. The medication is distributed by TruPharma, LLC, located in Tampa, FL, and manufactured by Rubicon Research Private Limited in India.*