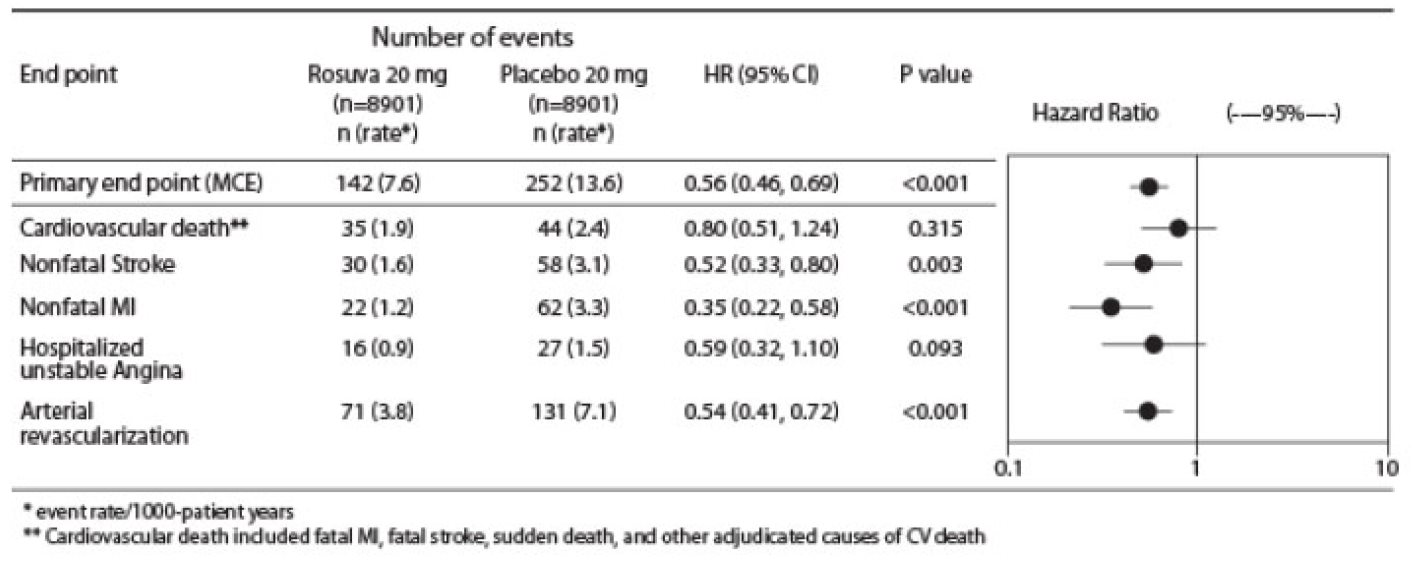
Figure1 (Figure1)

This text provides statistics related to a study, showing a hazard ratio of 0.56 with a 95% confidence interval of 0.46-0.69. Additionally, it indicates that there was a significant difference with p<0.001 between the two groups being compared. The data also includes the cumulative incidence in percentage and the number at risk in each group.*