Tamsulosin Hydrochloride
Product Images NDC 67296-1646

7 FDA label images from Redpharm Drug. Inc. · Packaging, Regulatory Labels, and Product Appearance

Product Visual Gallery

This gallery contains 7 technical images submitted to the FDA as part of the official labeling for Tamsulosin Hydrochloride (NDC 67296-1646). Unlike standard consumer photos, these assets often include clinical data figures, molecular chemical structures, and official manufacturer packaging layouts.

As provided by Redpharm Drug. Inc., these visuals offer a comprehensive scientific overview of the product's physical and chemical identity, aiding pharmacists and researchers in product verification and study.

FDA Label Image

Label (Tamsulosin 1646)

Label (Tamsulosin 1646)
Two drug labels for Tamsulosin Hydrochloride 0.4 mg capsules. One label is for a 10-capsule package with NDC 67296-1646-1 and expiration 08/20; the other for a 7-capsule package with NDC 67296-1646-7 and expiration 05/20. Both are Rx only, manufactured by Alkem Laboratories Ltd. in Mumbai, India, and distributed by Redpharm Drug in Eden Prairie, MN.*
FDA Label Image

Tamsulosin-figure1 (Tamsulosin Figure1)

Tamsulosin-figure1 (Tamsulosin Figure1)
A pharmacokinetic concentration-time graph depicting plasma concentration (ng/mL) versus time (hours) comparing the plasma concentration profiles of Tamsulosin Hydrochloride under fasted and fed states. The graph shows differences in concentration peaks and time course over 36 hours for both conditions.*
FDA Label Image

Tamsu-fi2a (Tamsulosin Figure2a)

Tamsu-fi2a (Tamsulosin Figure2a)
A line chart showing mean change over a 13-week treatment duration for Tamsulosin Hydrochloride 0.8 mg, 0.4 mg, and placebo groups. The x-axis represents weeks of treatment, and the y-axis shows mean change values. The chart compares treatment effects across different doses and placebo over time.*
FDA Label Image

Tamsu-fig2b (Tamsulosin Figure2b)

Tamsu-fig2b (Tamsulosin Figure2b)
A line graph depicting mean change over treatment duration in weeks for Tamsulosin Hydrochloride at doses 0.4 mg and 0.8 mg compared to placebo. The x-axis shows treatment duration from 0 to 13 weeks and LOCE, while the y-axis shows mean change values. Different symbols represent 0.8 mg, 0.4 mg, and placebo groups.*
FDA Label Image

Tamsu-fig3a (Tamsulosin Figure3a)

Tamsu-fig3a (Tamsulosin Figure3a)
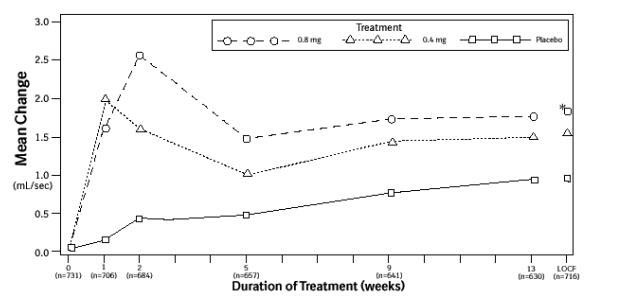
Line graph illustrating mean change in flow rate (mL/sec) over duration of treatment in weeks. The graph compares three groups: 0.8 mg treatment, 0.4 mg treatment, and placebo, with time points marked from 0 to 13 weeks and open-label extension (LOCE).*
FDA Label Image

Tamsu-fig3b (Tamsulosin Figure3b)

Tamsu-fig3b (Tamsulosin Figure3b)
A line graph showing the mean change in mL/sec over the duration of treatment in weeks for three groups: 0.8 mg dose, 0.4 mg dose, and placebo. The graph tracks changes from baseline through 13 weeks, with each group represented by different symbols and lines indicating treatment effects over time.*
FDA Label Image

Tamsulosin-structure (Tamsulosin Structure)

Tamsulosin-structure (Tamsulosin Structure)
Chemical structure of Tamsulosin Hydrochloride, depicting its molecular composition and arrangement. The structure includes aromatic rings, functional groups such as methoxy and sulfonamide, and the hydrochloride component.*

* About these descriptions: Image descriptions on this page are generated by automated AI analysis of the product label images from the manufacturer's FDA label submission (SPL). They are provided for reference only and may contain errors or omissions. Always rely on the printed label itself and the official FDA labeling, and consult a pharmacist or healthcare professional with any questions about this product.