Eliquis
Product Images NDC 67296-1673

8 FDA label images from Redpharm Drug, Inc. · Packaging, Regulatory Labels, and Product Appearance

Product Visual Gallery

This gallery contains 8 technical images submitted to the FDA as part of the official labeling for Eliquis (NDC 67296-1673). Unlike standard consumer photos, these assets often include clinical data figures, molecular chemical structures, and official manufacturer packaging layouts.

As provided by Redpharm Drug, Inc., these visuals offer a comprehensive scientific overview of the product's physical and chemical identity, aiding pharmacists and researchers in product verification and study.

FDA Label Image

67296 1673 7

67296 1673 7
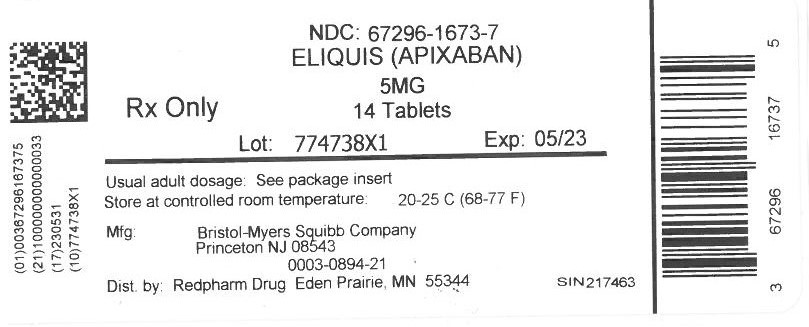
Label for ELIQUIS (Apixaban) 5 mg tablets by RedPharm Drug, Inc. The label shows a 14-tablet package, Rx Only, with lot number 774738X1 and expiration date 05/23. Manufactured by Bristol-Myers Squibb Company, Princeton, NJ, and distributed by Redpharm Drug, Eden Prairie, MN. Storage instructions specify controlled room temperature (20-25°C). Barcode and QR code are present.*
FDA Label Image

Label (Eliquis 1673)

Label (Eliquis 1673)
Two drug labels for Eliquis (Apixaban) 5 mg tablets from RedPharm Drug, Inc. The first label is for 12 tablets with lot number K2973AX1, expiration 08/21. The second is for 28 tablets with lot number L2421AX1, expiration 09/21. Both specify Rx only, usual adult dosage refers to package insert, storage at 20-25°C, manufactured by Bristol-Myers Squibb Company, Princeton, NJ, and distributed by RedPharm Drug, Eden Prairie, MN.*
FDA Label Image

Apixaban Chemical Structure (Apixaban Struct)

Apixaban Chemical Structure (Apixaban Struct)
Chemical structure of the active ingredient in ELIQUIS, as shown in the diagram. The structure features multiple rings and functional groups, representing the molecular layout of the compound.*
FDA Label Image

Aristotle Forest Plot (Eliquis Clin Forest Fig5)

Aristotle Forest Plot (Eliquis Clin Forest Fig5)
A forest plot comparing the hazard ratios and 95% confidence intervals of various patient subgroups for Apixaban versus Warfarin. The chart details the number of events and patients per group, with subgroups defined by prior medication status, age, sex, weight, prior stroke or TIA, diabetes mellitus, CHADS2 score, creatinine clearance, geographic region, and aspirin use at randomization. The hazard ratio axis indicates whether Apixaban or Warfarin is favored in each subgroup.*
FDA Label Image

Aristotle Major Bleeding Forest Plot (Eliquis Forest Fig1)

Aristotle Major Bleeding Forest Plot (Eliquis Forest Fig1)
A forest plot chart depicting hazard ratios with 95% confidence intervals comparing Apixaban versus Warfarin across various subgroups. The chart shows the number of events, patients, and percentage per year by subgroup, with subgroups including prior warfarin/VKA status, age, sex, weight, prior stroke or TIA, diabetes mellitus, CHADS2 score, creatinine clearance, geographic region, and aspirin use at randomization. The horizontal axis indicates whether Apixaban or Warfarin is favored.*
FDA Label Image

Aristotle Kaplan-meier Curve (Eliquis Km Fig4)

Aristotle Kaplan-meier Curve (Eliquis Km Fig4)
A Kaplan-Meier curve chart comparing the proportion of subjects with stroke or systemic embolism over 36 months between ELIQUIS and Warfarin. The chart includes event counts and p-value data, with a table showing the number of subjects at risk at different time points for both treatments.*
FDA Label Image

Effect Of Coadministered Drugs On Pharmacokinetics Of Apixaban (Eliquis Pkplot Drugs Fig2)

Effect Of Coadministered Drugs On Pharmacokinetics Of Apixaban (Eliquis Pkplot Drugs Fig2)
A pharmacokinetic chart showing fold change and 90% confidence intervals for the interaction of various drugs with ELIQUIS. The drugs listed include Ketoconazole 400 mg, Clarithromycin 500 mg, Diltiazem 360 mg, Naproxen 500 mg, and Rifampin 600 mg, categorized by combined P-gp and strong CYP3A4 inhibitors, other CYP3A4 and P-gp inhibitors, and combined P-gp and strong CYP3A4 inducer. The graph measures change relative to reference for Cmax and AUC values.*
FDA Label Image

O:\e-submissions\pbo\products\eliquis 202155\08. Pas Esrd Dosing\01. Orig Submission\source\eliquis-pkplot-pop-fig3.jpg (Eliquis Pkplot Pop Fig3)

O:\e-submissions\pbo\products\eliquis 202155\08. Pas Esrd Dosing\01. Orig Submission\source\eliquis-pkplot-pop-fig3.jpg (Eliquis Pkplot Pop Fig3)
A forest plot chart displaying pharmacokinetic (PK) parameters, including Cmax and AUC, comparing fold change and 90% confidence intervals for various populations relative to reference. Populations include end-stage renal disease, renal impairment (severe, moderate, mild), age groups, body weight categories, and hepatic impairment levels, with corresponding dose adjustment recommendations.*

* About these descriptions: Image descriptions on this page are generated by automated AI analysis of the product label images from the manufacturer's FDA label submission (SPL). They are provided for reference only and may contain errors or omissions. Always rely on the printed label itself and the official FDA labeling, and consult a pharmacist or healthcare professional with any questions about this product.