Finasteride
Product Images NDC 67296-2056

View Photos of Packaging, Regulatory Labels, and Product Appearance

Product Visual Gallery

This gallery contains 6 technical images submitted to the FDA as part of the official labeling for Finasteride (NDC 67296-2056). Unlike standard consumer photos, these assets often include clinical data figures, molecular chemical structures, and official manufacturer packaging layouts.

As provided by Redpharm Drug, these visuals offer a comprehensive scientific overview of the product's physical and chemical identity, aiding pharmacists and researchers in product verification and study.

FDA Label Image

Chemical Structure (Image 1)
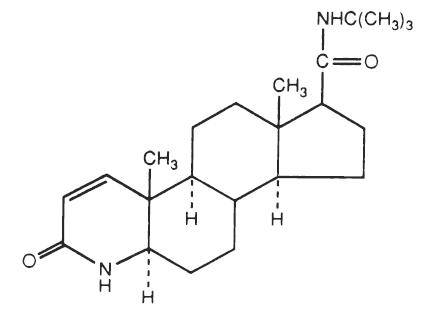
Chemical Structure (Image 1)
Chemical structure of finasteride showing its molecular framework with rings, methyl groups, and functional groups including an amide and ketone.*
FDA Label Image

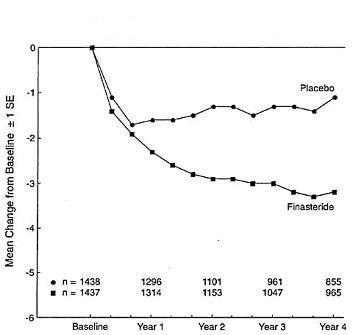
Figure 1 Symptom Score In Long-term Efficacy And Safety Study (Image 2)

Figure 1 Symptom Score In Long-term Efficacy And Safety Study (Image 2)
A line graph showing mean change from baseline over a four-year period, comparing Finasteride and placebo groups. The x-axis represents time from baseline through Year 4, while the y-axis shows mean change with standard error. Finasteride shows a greater decrease over time compared to placebo.*
FDA Label Image

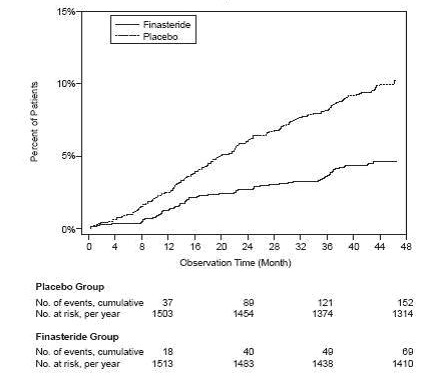
Figure 2 Percent Of Patients Having Surgery For Bph, Including Turp (Image 3)

Figure 2 Percent Of Patients Having Surgery For Bph, Including Turp (Image 3)
A line graph comparing the cumulative percent of patients over 48 months between Finasteride and Placebo groups. The x-axis represents observation time in months, and the y-axis shows the percent of patients, with lines indicating outcomes for each group. Beneath the graph are tables summarizing event counts and risk numbers for both groups at various time points.*
FDA Label Image

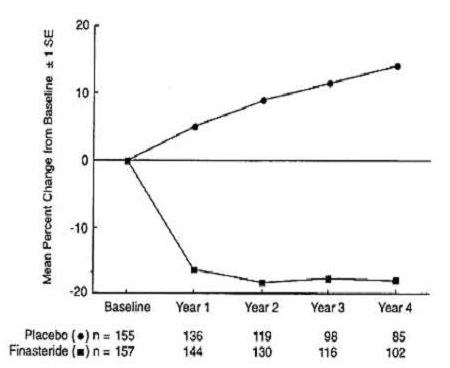
Figure 4 (Image 4)

Figure 4 (Image 4)
A line graph showing mean percent change from baseline with standard error across five time points: Baseline, Year 1, Year 2, Year 3, and Year 4. Two datasets are compared: Placebo (circles) and Finasteride (squares). The Placebo group shows an increasing positive trend over time, while the Finasteride group shows a decreasing negative trend that levels off after Year 1.*
FDA Label Image

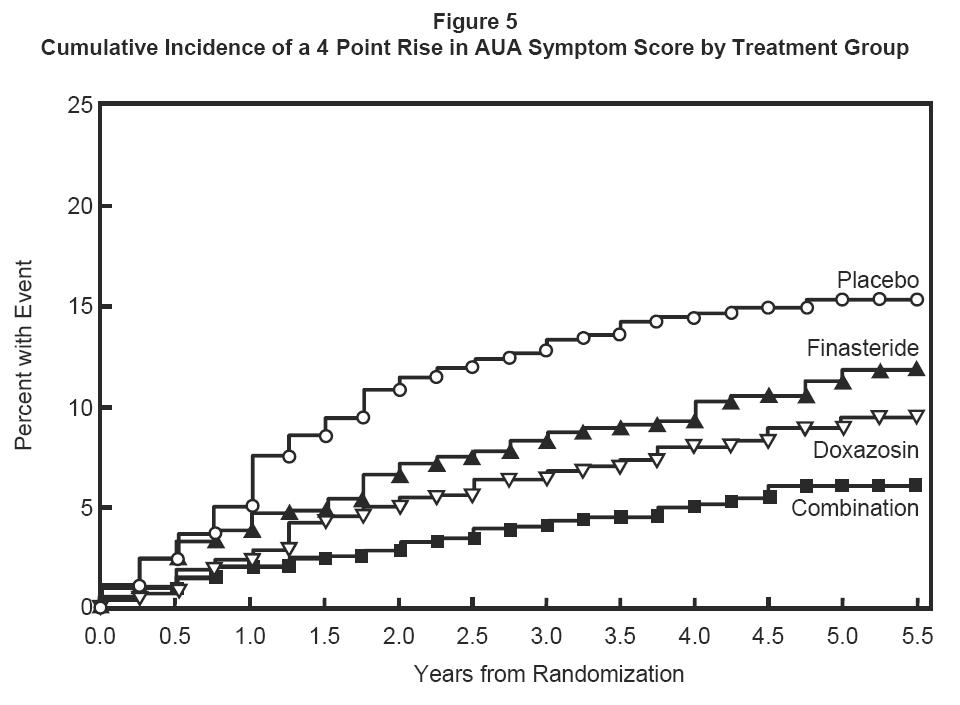
Figure 5 (Image 5)

Figure 5 (Image 5)
A line graph titled 'Cumulative Incidence of a 4 Point Rise in AUA Symptom Score by Treatment Group' showing the percent with event on the y-axis and years from randomization on the x-axis. It compares four groups: Placebo, Finasteride, Doxazosin, and Combination, illustrating variation in symptom score increases over approximately 5.5 years.*
FDA Label Image

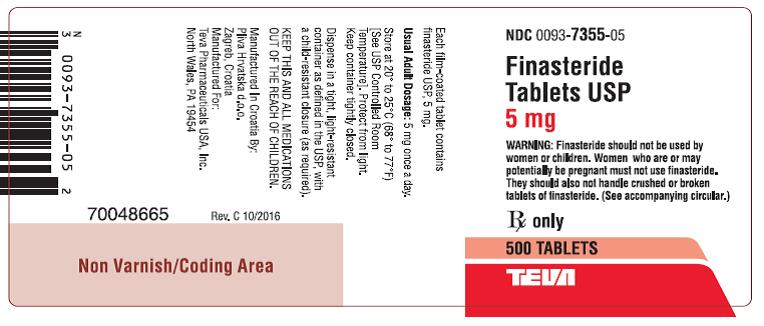
Label 5 mg, 500 Tablets (Image 6)

Label 5 mg, 500 Tablets (Image 6)
Finasteride Tablets USP 5 mg label displaying product NDC 0093-7355-05 and packaging for 500 tablets by Teva Pharmaceuticals USA. The label includes storage instructions, medication warnings about use by women and children, and a note to keep the product out of reach of children. The label also contains a barcode and detailed handling instructions.*

* About these descriptions: Image descriptions on this page are generated by automated AI analysis of the product label images from the manufacturer's FDA label submission (SPL). They are provided for reference only and may contain errors or omissions. Always rely on the printed label itself and the official FDA labeling, and consult a pharmacist or healthcare professional with any questions about this product.