Clopidogrel
Product Images NDC 67296-2060

View Photos of Packaging, Regulatory Labels, and Product Appearance

Product Visual Gallery

This gallery contains 11 technical images submitted to the FDA as part of the official labeling for Clopidogrel (NDC 67296-2060). Unlike standard consumer photos, these assets often include clinical data figures, molecular chemical structures, and official manufacturer packaging layouts.

As provided by Redpharm Drug, these visuals offer a comprehensive scientific overview of the product's physical and chemical identity, aiding pharmacists and researchers in product verification and study.

FDA Label Image

Figure 1 (Clopidogrel Fig1)

Figure 1 (Clopidogrel Fig1)
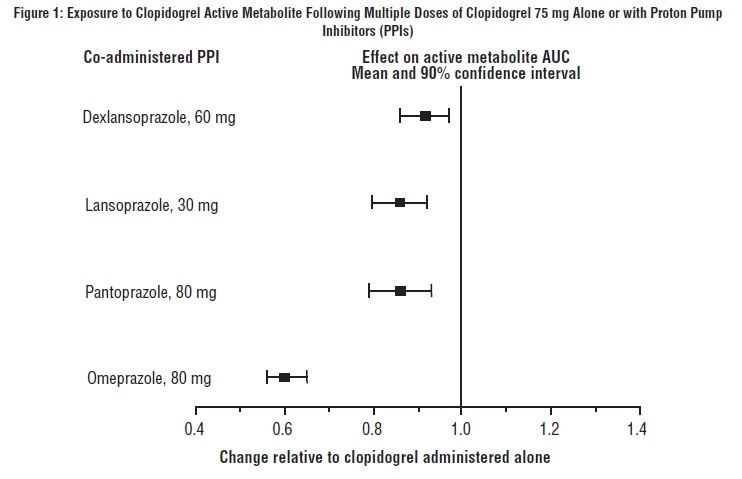
This text provides information on the exposure to Clopidogrel Active Metabolite following multiple doses of Clopidogrel 75 mg alone or with proton pump inhibitors (PPIs). It includes the mean and 90% confidence interval for the co-administered PPIs such as Dexlansoprazole, Lansoprazole, Pantoprazole, and Omeprazole. The text also mentions the change relative to Clopidogrel administered alone.*
FDA Label Image

Package Label-principal Display Panel (75 mg Blister Carton (10 x 10 Unit-dose))

FDA Label Image

Figure 2: Cardiovascular Death, Myocardial Infarction, And Stroke In The Cure Study (Clopidogrel Fig2)

Figure 2: Cardiovascular Death, Myocardial Infarction, And Stroke In The Cure Study (Clopidogrel Fig2)
This chart displays the cumulative event rate (%) of cardiovascular death, myocardial infarction, and stroke over a period of 12 months of follow-up for patients on placebo (+ aspirin) and clopidogrel (+ aspirin). The data suggests a significant difference between the two treatments with a P-value of 0.00009.*
FDA Label Image

Figure-3 (Clopidogrel Fig3)

Figure-3 (Clopidogrel Fig3)
This text seems to be a data table showing different parameters related to a medical study or clinical trial. It includes information on subgroups based on race, various medical conditions, medications like Heparin and Aspirin, and their effects on outcomes such as cardiovascular events. The table also details the comparison between Clopidogrel and Placebo in terms of efficacy and safety.*
FDA Label Image

Figure 4: Cumulative Event Rates For Death In The Commit Study (Clopidogrel Fig4)

Figure 4: Cumulative Event Rates For Death In The Commit Study (Clopidogrel Fig4)
This text provides data on the effectiveness of Clopidogrel compared to a placebo in reducing the risk of death before the first discharge. It shows that Clopidogrel had a lower percentage of deaths (7.5%) compared to the placebo group (8.1%), resulting in a 7% proportional risk reduction with a statistically significant p-value of 0.03. The data is based on a study that tracked the outcomes up to 28 days after randomization.*
FDA Label Image

Figure 5: Cumulative Event Rates For The Combined Endpoint Re-infarction, Stroke Or Death In The Commit Study (Clopidogrel Fig5)

Figure 5: Cumulative Event Rates For The Combined Endpoint Re-infarction, Stroke Or Death In The Commit Study (Clopidogrel Fig5)
This text provides comparative data on the effects of Placebo and Clopidogrel in reducing the risk of death, re-infarction, or stroke. It shows that Clopidogrel has a 9% proportional risk reduction compared to Placebo with a 7% reduction in death and a positive impact on re-infarction or stroke before discharge within the first 28 days of treatment.*
FDA Label Image

Figure 6: Effects Of Adding Clopidogrel Bisulfate To Aspirin On The Combined Primary Endpoint Across Baseline And Concomitant Medication Subgroups For The Commit Study (Clopidogrel Fig6)

Figure 6: Effects Of Adding Clopidogrel Bisulfate To Aspirin On The Combined Primary Endpoint Across Baseline And Concomitant Medication Subgroups For The Commit Study (Clopidogrel Fig6)
This text appears to be a statistical table displaying subgroup data related to the administration of Clopidogrel versus Placebo in a clinical study. The table includes information on gender, age groups, hours since onset, systolic blood pressure, heart rate, and whether a fibrinolytic agent was given. The data is presented in terms of the number of subjects, percentages, and odds ratios. It provides a detailed breakdown of how each subgroup responded to Clopidogrel versus Placebo, indicating if one treatment was favored over the other.*
FDA Label Image

Figure 7: Fatal Or Non-fatal Vascular Events In The Caprie Study (Clopidogrel Fig7)

Figure 7: Fatal Or Non-fatal Vascular Events In The Caprie Study (Clopidogrel Fig7)
This is data showing the cumulative event rate (in percentage) over time for fatal or non-fatal vascular events with aspirin and clopidogrel over a follow-up period of 36 months. The table includes the event rates at 6, 12, 18, 24, 30, and 36 months. It is useful for evaluating the efficacy of aspirin and clopidogrel in preventing vascular events.*
FDA Label Image

Figure 8: Hazard Ratio And 95% Ci By Baseline Subgroups In The Caprie Study (Clopidogrel Fig8)

Figure 8: Hazard Ratio And 95% Ci By Baseline Subgroups In The Caprie Study (Clopidogrel Fig8)
Qualifying Condition data related to Stroke and PAD for Clopidogrel and Aspirin. The table shows the number of patients, percentages, and hazard ratio for each treatment group. The data seems to be from a study or clinical trial.*
FDA Label Image

Package Label-principal Display Panel (75 mg (30 Tablets Bottle))

Package Label-principal Display Panel (75 mg (30 Tablets Bottle))
These are Clopidogrel Tablets, USP with each tablet containing 75 mg of clopidogrel base. The medication is dispensed with a Medication Guide for each patient. It is recommended to follow the usual adult dosage as per the package insert. The tablets should be stored in well-closed containers at 20° to 25°C with permissible excursions between 15° to 30°C. The product is distributed by Aurobindo Pharma USA, Inc. from India.*
FDA Label Image

Chemical Structure (Clopidogrel Str)

* These product label images have been analyzed using experimental machine learning. Please verify findings with the primary label text.