Tamsulosin Hydrochloride Capsule
Product Images NDC 67296-2220

View Photos of Packaging, Regulatory Labels, and Product Appearance

Product Visual Gallery

This gallery contains 7 technical images submitted to the FDA as part of the official labeling for Tamsulosin Hydrochloride (NDC 67296-2220). Unlike standard consumer photos, these assets often include clinical data figures, molecular chemical structures, and official manufacturer packaging layouts.

As provided by Redpharm Drug, these visuals offer a comprehensive scientific overview of the product's physical and chemical identity, aiding pharmacists and researchers in product verification and study.

FDA Label Image

Figure (Tamsulosin Fig1)

Figure (Tamsulosin Fig1)
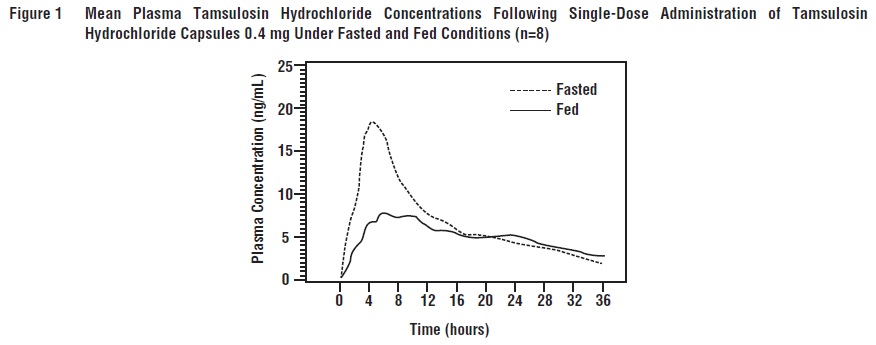
This is a scientific figure showing the mean plasma concentrations of Tamsulosin Hydrochloride capsules 0.4 mg over time under both fasted and fed conditions. The graph displays the plasma concentration (ng/mL) at different time points (0, 4, 8, 12, 16, 20, 24, 28, 32, 36 hours) for 8 individuals.*
FDA Label Image

Figure (Tamsulosin Fig2)

Figure (Tamsulosin Fig2)
This is a statistical chart showing the mean change from baseline in the Total AUA Symptom Score for different treatments over a period of weeks. The treatments compared are 0.8mg A, A-0.8mg-T, 0-C-Placebo. The study involves a sample size ranging from 516 to 755 participants, with a duration of treatment in weeks. This data can be used to analyze the effectiveness of these treatments in managing symptoms.*
FDA Label Image

Figure (Tamsulosin Fig3)

FDA Label Image

Figure (Tamsulosin Fig4)

FDA Label Image

Figure (Tamsulosin Fig5)

Figure (Tamsulosin Fig5)
This text provides information on the mean increase in peak urine flow rate for Study 2. It includes data on different treatments, duration of treatment in weeks, and the number of participants for each treatment group.*
FDA Label Image

Package Label-principal Display Panel (0.4 mg (100 Capsules Bottle))

FDA Label Image

Chemical Structure (Tamsulosin Str)

* These product label images have been analyzed using experimental machine learning. Please verify findings with the primary label text.