Ticagrelor Tablet, Film Coated
Product Images NDC 67296-2268

View Photos of Packaging, Regulatory Labels, and Product Appearance

Product Visual Gallery

This gallery contains 21 technical images submitted to the FDA as part of the official labeling for Ticagrelor (NDC 67296-2268). Unlike standard consumer photos, these assets often include clinical data figures, molecular chemical structures, and official manufacturer packaging layouts.

As provided by Redpharm Drug, these visuals offer a comprehensive scientific overview of the product's physical and chemical identity, aiding pharmacists and researchers in product verification and study.

FDA Label Image

Figure 10 (Ticagrelor 10figure)
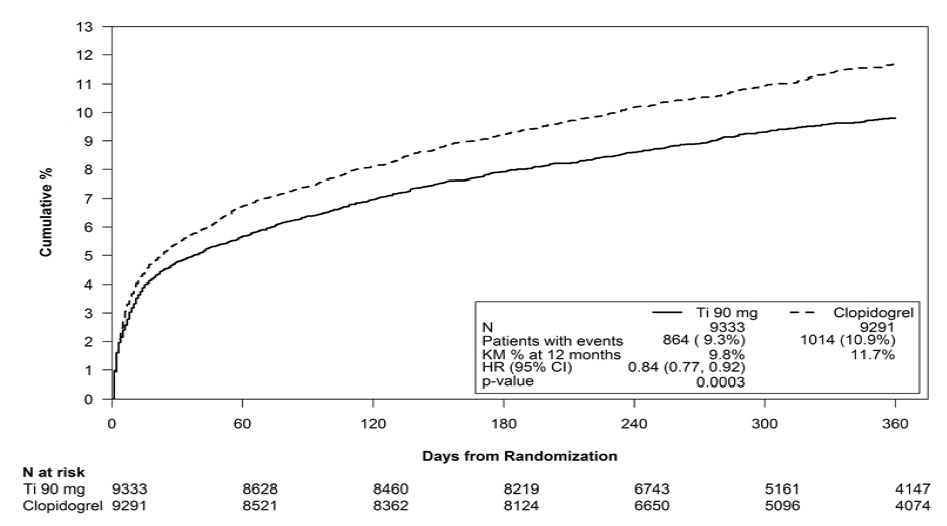
Figure 10 (Ticagrelor 10figure)
This text provides data on a study comparing two treatments, Ti9omg and Clopidogrel, for patients with events over a 12-month period. It includes percentages of patients experiencing events, hazard ratio with confidence interval, and the p-value. The table displays the number of patients at risk at different time points from randomization for both treatments.*
FDA Label Image

Figure 11 (Ticagrelor 11figure)

Figure 11 (Ticagrelor 11figure)
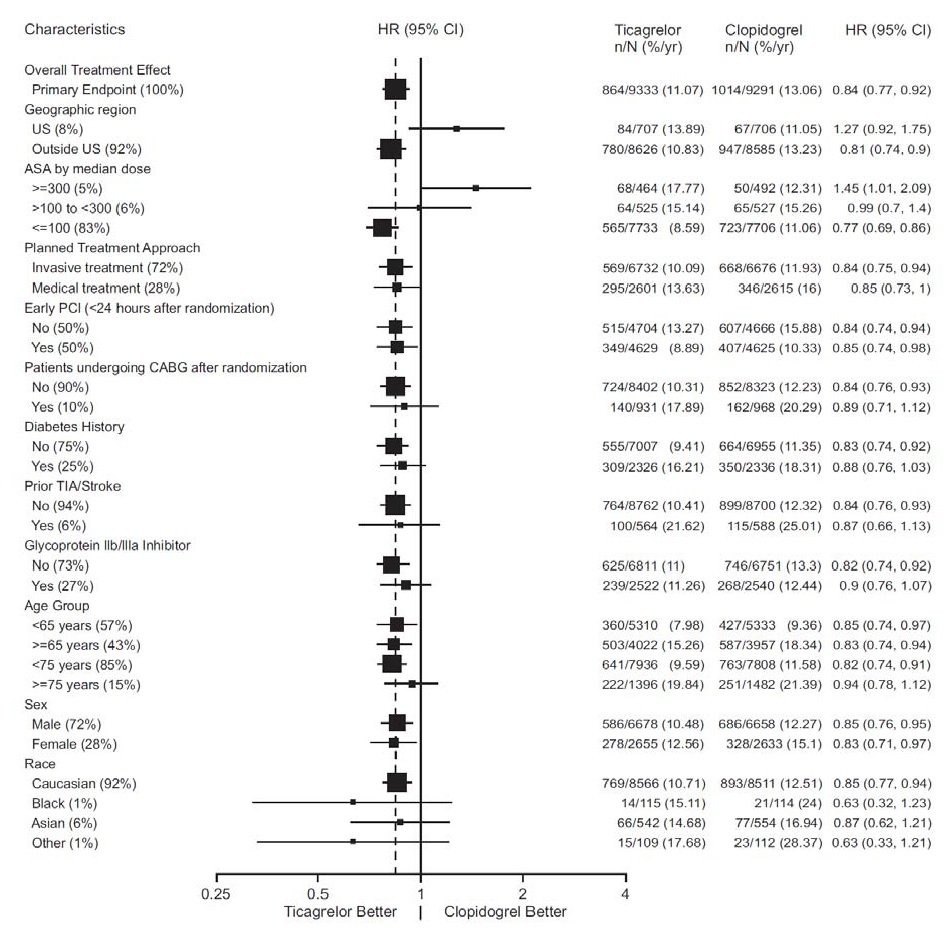
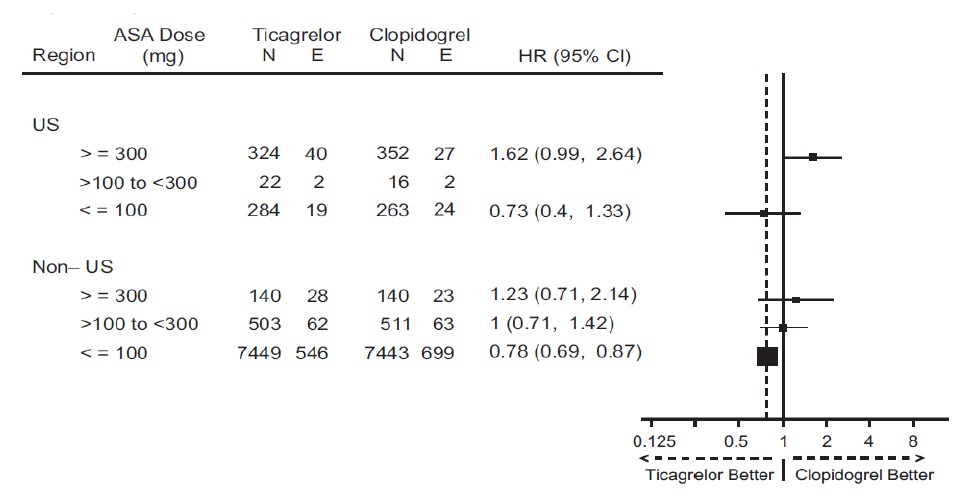
This text contains information about a clinical study evaluating the characteristics of different treatment approaches and patient demographics. The study includes data on geographic regions, ASA doses, treatment approaches (invasive vs. medical), timing of PCI (percutaneous coronary intervention), history of conditions like diabetes, prior TIA/Stroke, and the use of Glycoprotein IIb/IIIa Inhibitors. Additionally, it provides details on the distribution of patients based on age groups, gender, and race. The text also presents numerical data for Ticagrelor and Clopidogrel treatments, including the number of patients and event rates, as well as hazard ratios with confidence intervals. The study compares the efficacy of Ticagrelor versus Clopidogrel and reports whether one treatment is better than the other based on the provided data.*
FDA Label Image

Figure 12 (Ticagrelor 12figure)

FDA Label Image

Figure 13 (Ticagrelor 13figure)

Figure 13 (Ticagrelor 13figure)
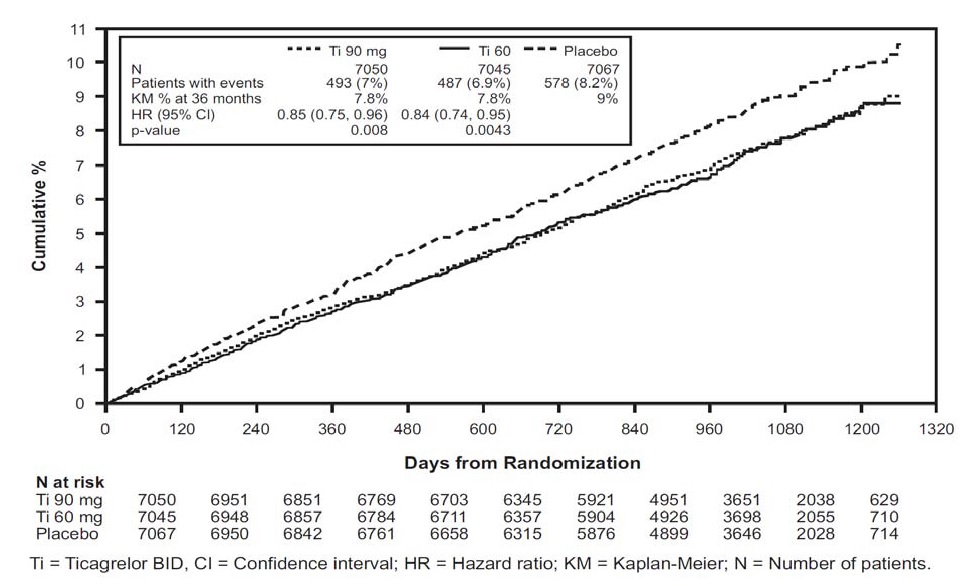
This is a statistical table showing the cumulative percentage of patients at risk over time in a study comparing the efficacy of different doses of Ticagrelor versus a placebo, along with the number of patients with events, survival rates, hazard ratios, and p-values for each group. The data is presented in a Kaplan-Meier format, with information on the number of patients at risk at certain time points, days from randomization, and definitions for the abbreviations used in the table.*
FDA Label Image

Figure 14 (Ticagrelor 14figure)

Figure 14 (Ticagrelor 14figure)
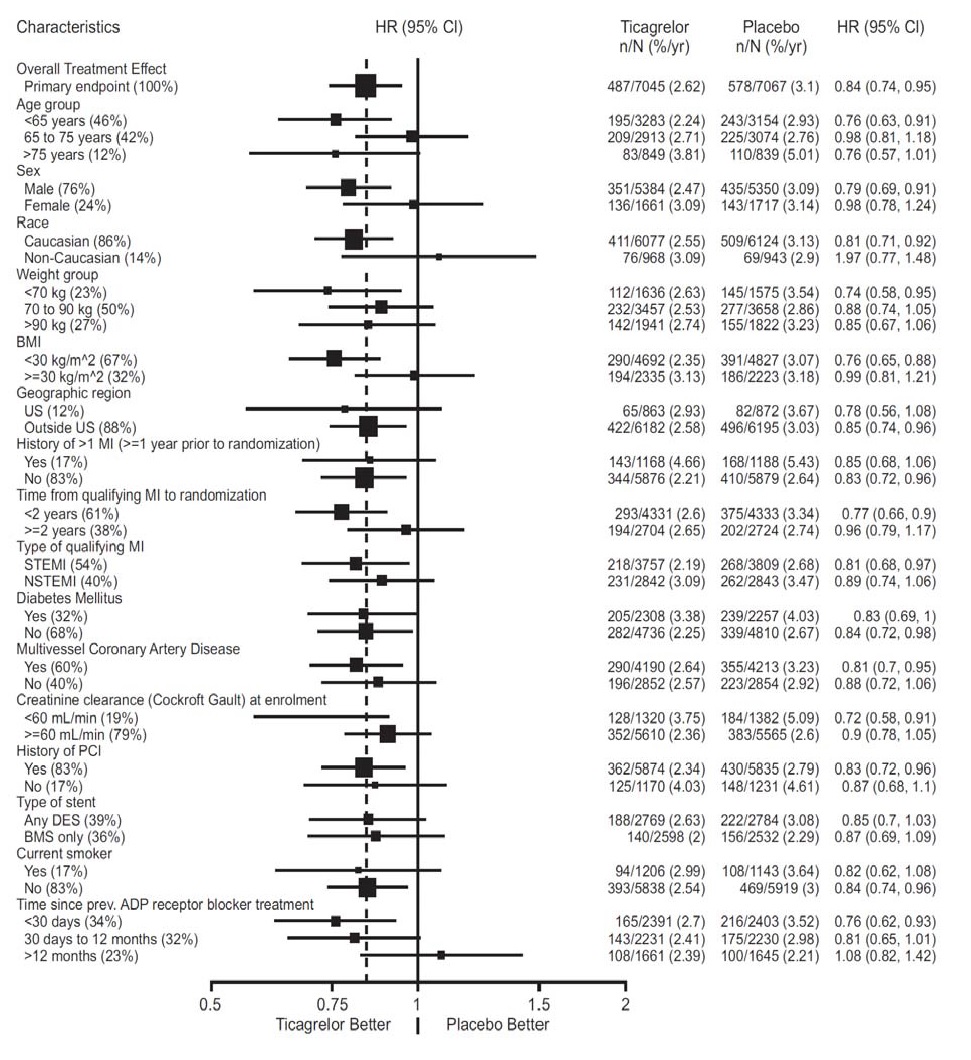
This information provides a detailed analysis of the characteristics of a study population based on various factors such as age, sex, race, weight, history of medical conditions like diabetes mellitus, multivessel coronary artery disease, and prior PCI, among others. It also includes statistics related to the treatment with Ticagrelor and Placebo, showing the number of occurrences and percentages. Furthermore, it presents the Hazard Ratios (HR) and their 95% Confidence Intervals (CI) to evaluate the effectiveness of the treatment. This data is valuable for understanding how different factors impact the outcomes of the treatment under study.*
FDA Label Image

Figure 15 (Ticagrelor 15figure)

FDA Label Image

Figure 16 (Ticagrelor 16figure)

Figure 16 (Ticagrelor 16figure)
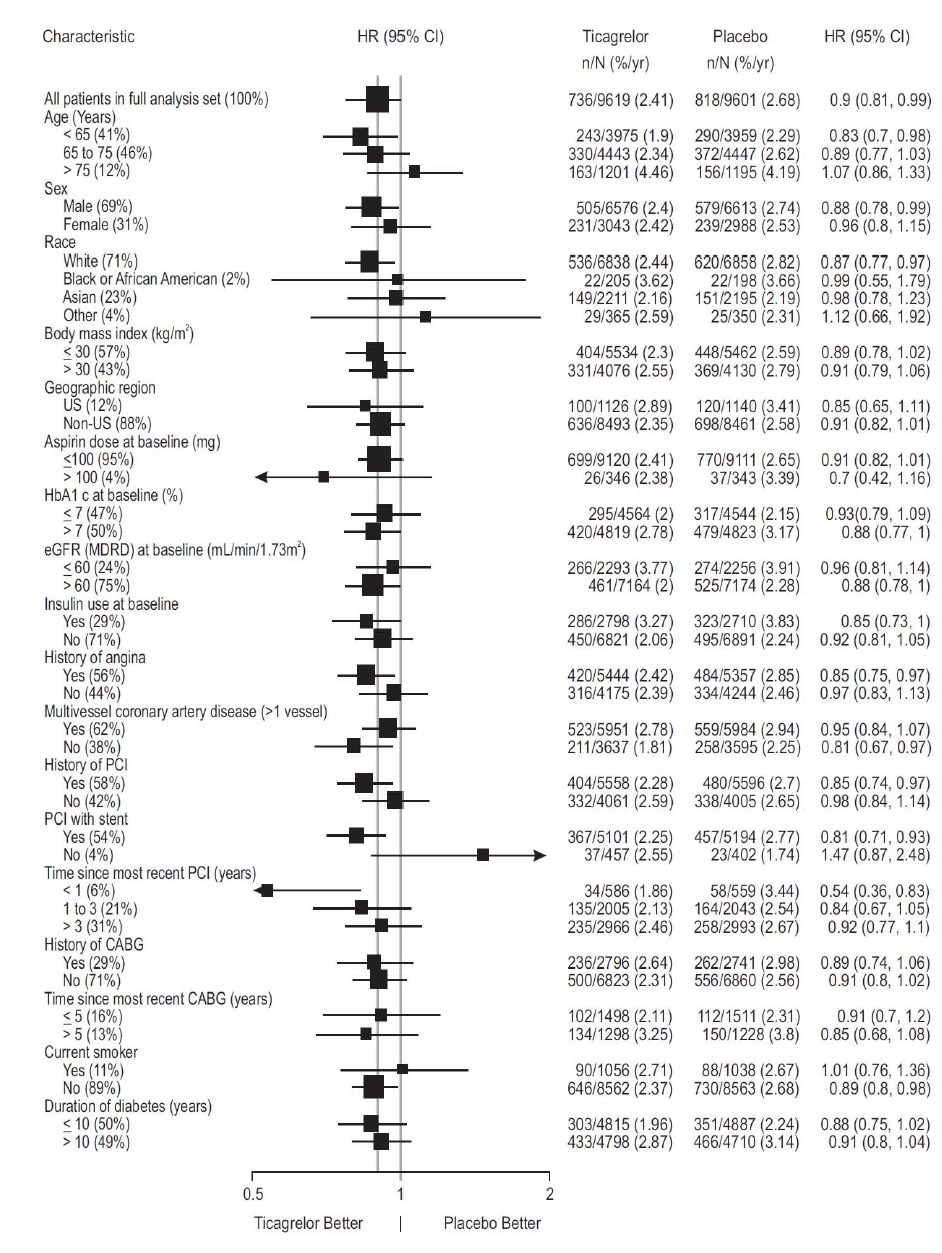
This text contains statistical data on the effects of ticagrelor compared to a placebo on different patient characteristics such as age, gender, race, body mass index, geographic region, aspirin dose, HbA1c levels, eGFR, insulin use, and medical history related to angina, coronary artery disease, PCI, stents, CABG, and smoking status. The data includes hazard ratios with confidence intervals for various subgroups based on the respective characteristics. The outcomes are reported in terms of which treatment (Ticagrelor or Placebo) was found to be superior in each subgroup.*
FDA Label Image

Figure 17 (Ticagrelor 17figur)

FDA Label Image

Figure 18 (Ticagrelor 18figur)

Figure 18 (Ticagrelor 18figur)
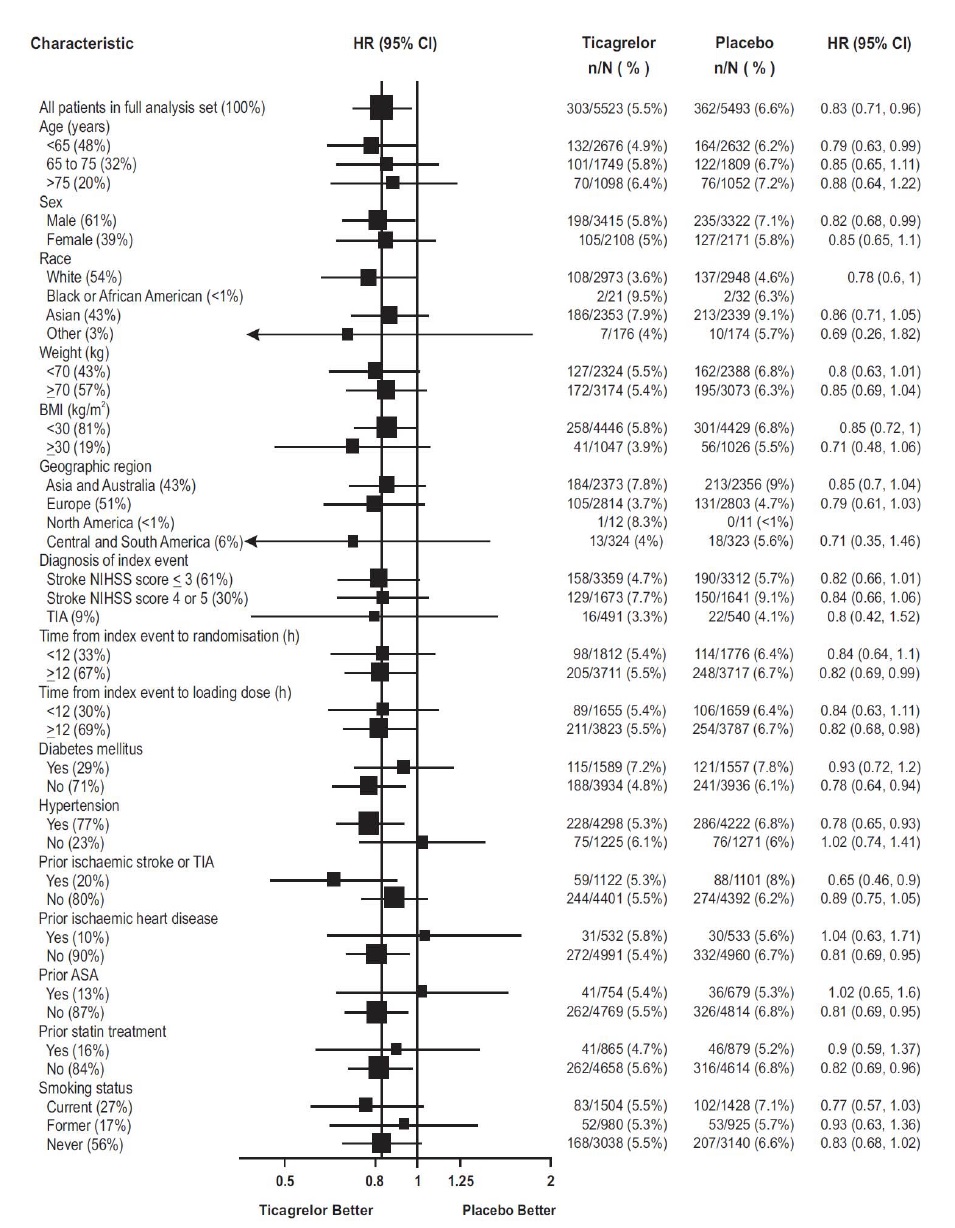
This text contains statistical data comparing the effectiveness of the drug Ticagrelor versus a placebo in treating a specific condition. The data includes information on characteristics such as age, sex, race, weight, BMI, geographic region, diagnosis of the index event, time from index event to randomization, diabetes mellitus, hypertension, prior stroke or TIA, prior heart disease, prior ASA use, prior statin treatment, and smoking status. The comparisons are presented in terms of hazard ratios with 95% confidence intervals for each characteristic. Overall, the data aims to provide insights into the efficacy of Ticagrelor compared to a placebo across different demographic and clinical variables.*
FDA Label Image

Figure 1 (Ticagrelor 1figure)

Figure 1 (Ticagrelor 1figure)
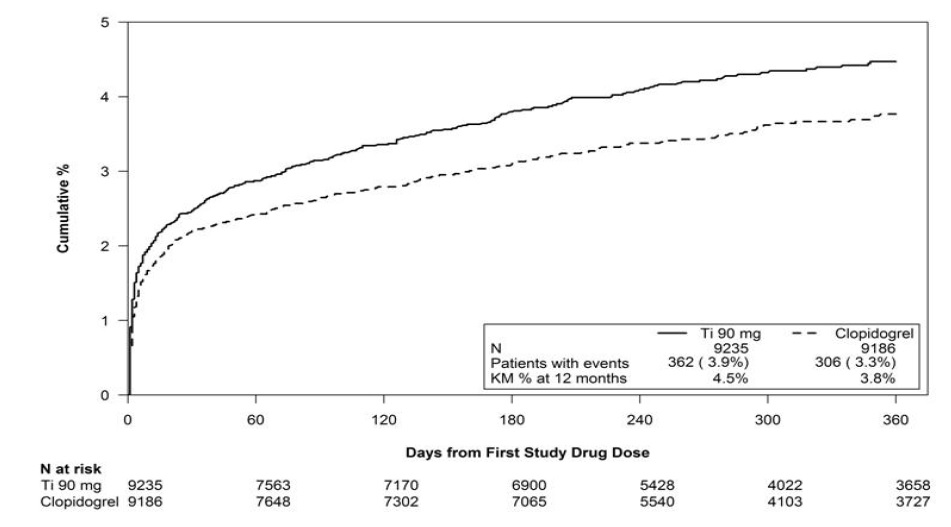
This information compares the efficacy of Ti90mg and Clopidogrel in patients with events, showing the percentage of events at 12 months and the number of days from the first study drug dose. The data suggests that Clopidogrel has a slightly lower percentage of events compared to Ti90mg at 12 months. This data could be useful for healthcare professionals and researchers when evaluating the effectiveness of these treatments.*
FDA Label Image

Figure 2 (Ticagrelor 2figure)

FDA Label Image

Figure 3 (Ticagrelor 3figure)

Figure 3 (Ticagrelor 3figure)
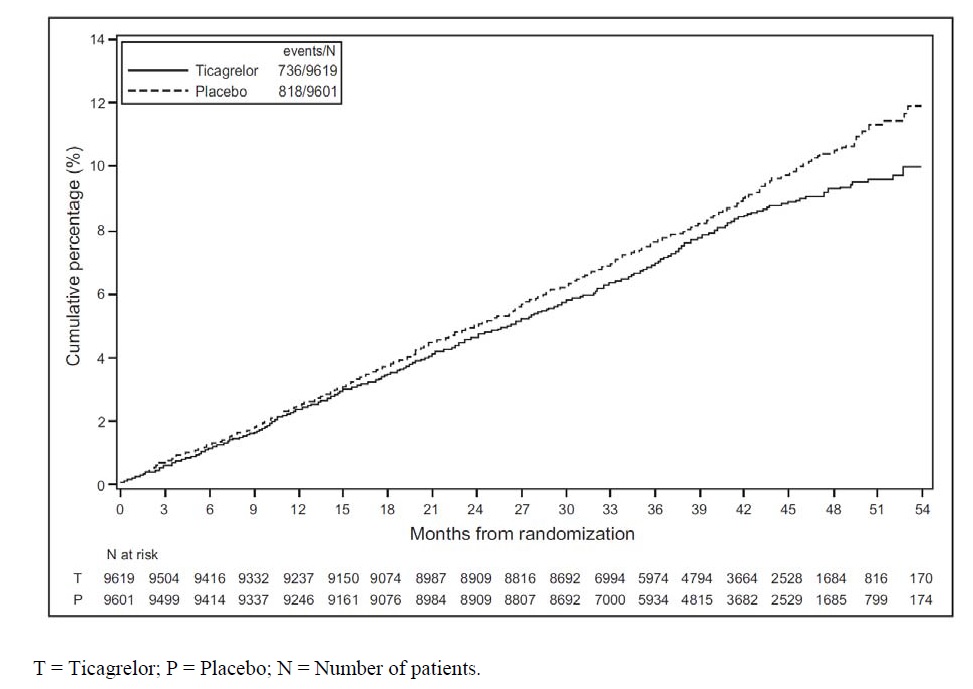
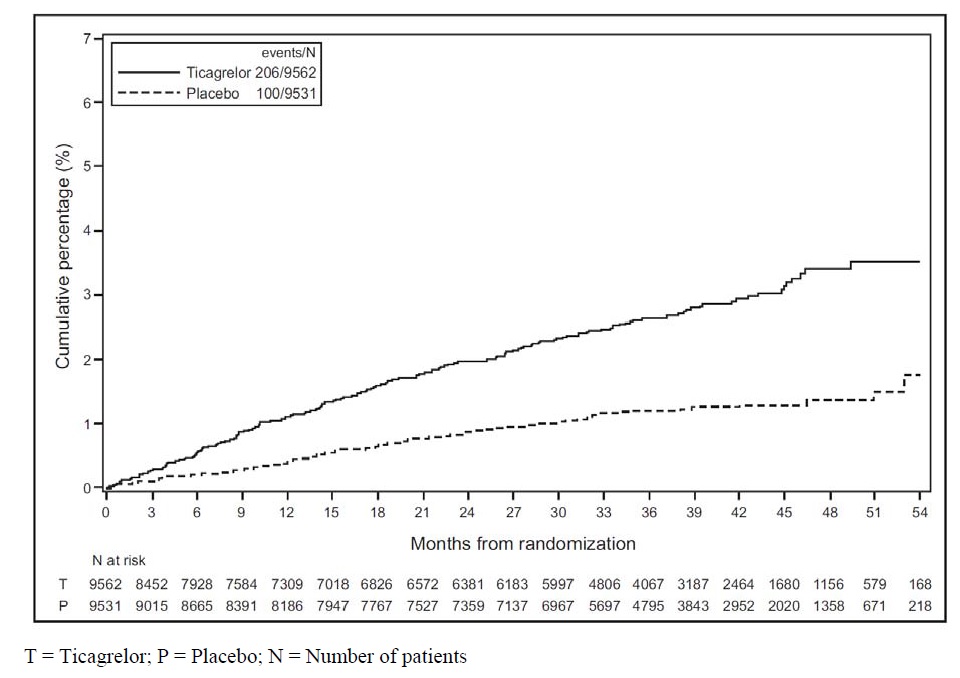
This is a data set showing the cumulative percentage of events over time for patients on Ticagrelor and Placebo. The numbers of patients under observation are listed for each month from randomization. The data includes the total number of patients (N) in each group and the corresponding number at risk each month.*
FDA Label Image

Figure 4 (Ticagrelor 4figure)

Figure 4 (Ticagrelor 4figure)
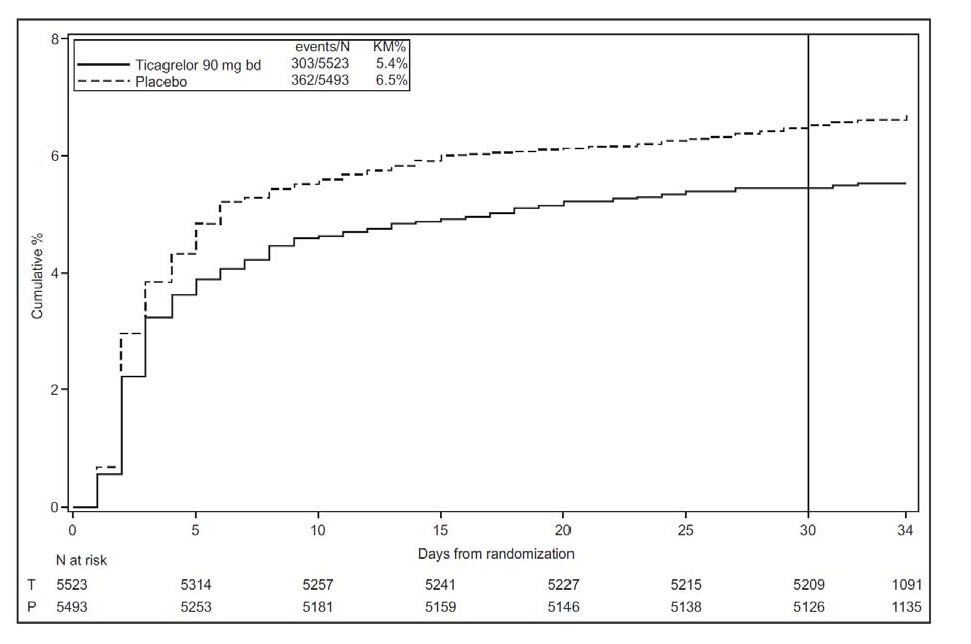
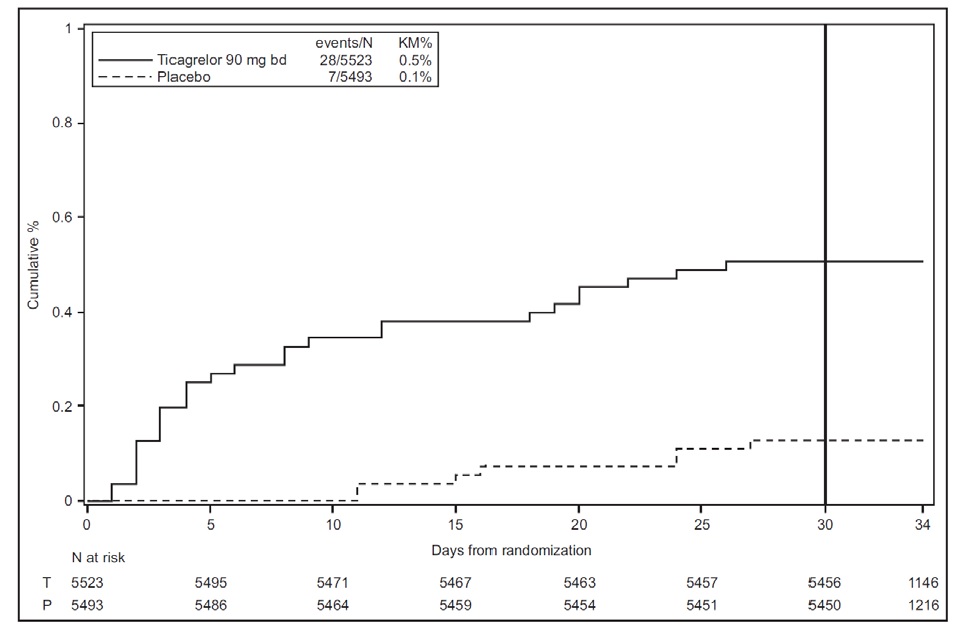
This information shows the Cumulative Percentage of events over time for a study comparing Ticagrelor 90mg twice daily versus Placebo. The data includes the number of events, Kaplan-Meier percentage, and the number of days from randomization.*
FDA Label Image

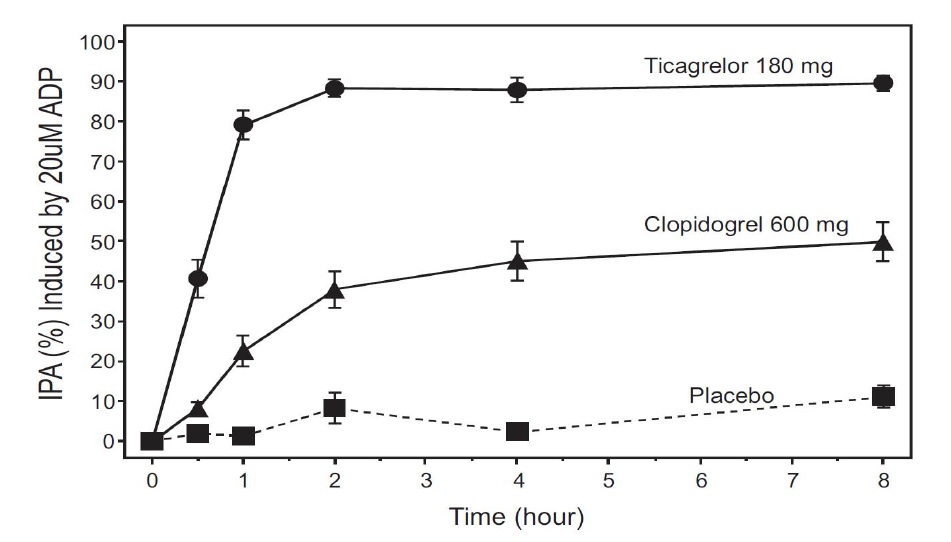
Figure 5 (Ticagrelor 5figure)

Figure 5 (Ticagrelor 5figure)
This text provides information about the percentage of IPA induced by 20uM ADP over time for Ticagrelor 180 mg and Clopidogrel 600 mg. The graph likely shows the time in hours on the x-axis and IPA (%) on the y-axis. This data can be used to compare the antiplatelet effects of Ticagrelor and Clopidogrel under the given conditions.*
FDA Label Image

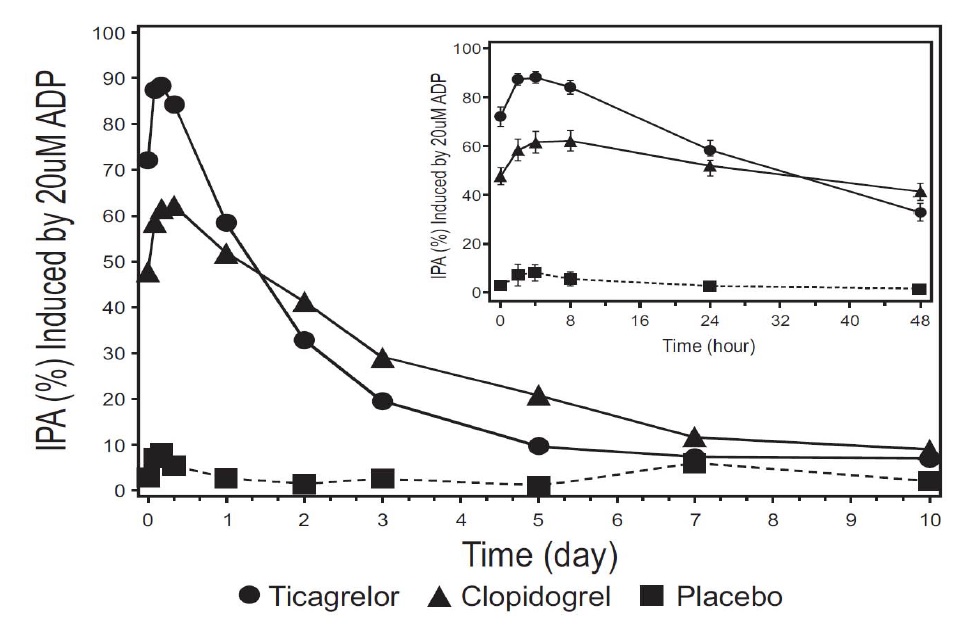
Figure 6 (Ticagrelor 6figure)

Figure 6 (Ticagrelor 6figure)
This text provides data on the percentage of inhibition of platelet aggregation (IPA) induced by 20uM ADP over a time period (days) for Ticagrelor, Clopidogrel, and Placebo. The values for Ticagrelor show 100% inhibition at day 4. This information can be used to evaluate the efficacy of these medications in inhibiting platelet aggregation.*
FDA Label Image

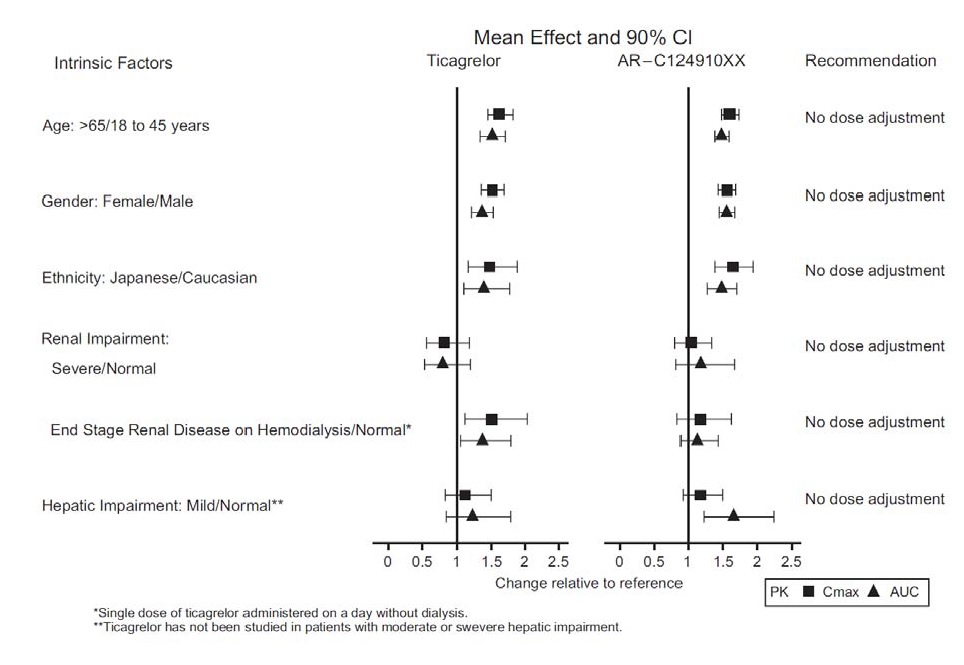
Figure 7 (Ticagrelor 7figure)

Figure 7 (Ticagrelor 7figure)
This text presents information on the recommended dose adjustments for Ticagrelor based on intrinsic factors such as age, gender, ethnicity, renal impairment, end-stage renal disease, and hepatic impairment. It also includes the mean effect and 90% confidence interval data. The text emphasizes that Ticagrelor has not been studied in patients with moderate or severe hepatic impairment.*
FDA Label Image

Figure 8 (Ticagrelor 8fig)

FDA Label Image

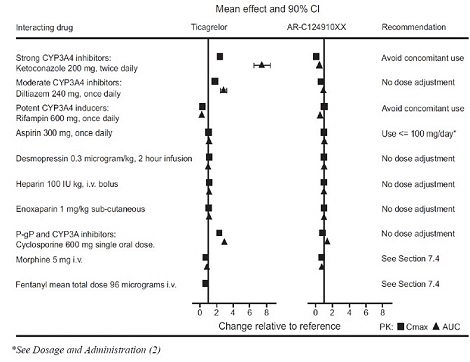
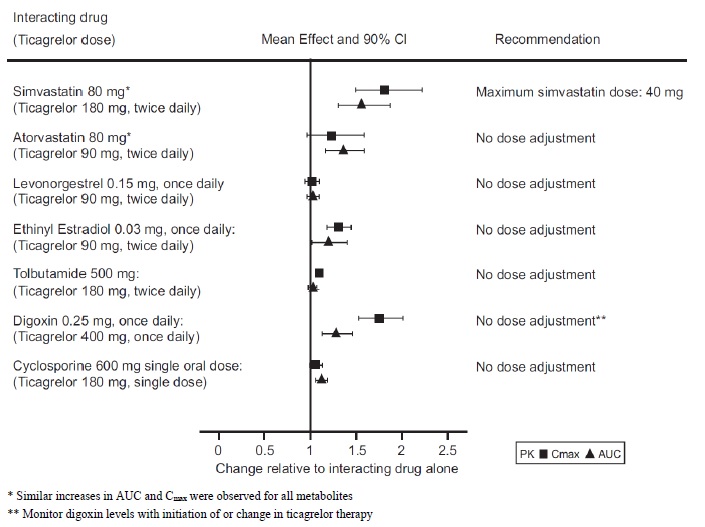
Figure 9 (Ticagrelor Figure 9)

Figure 9 (Ticagrelor Figure 9)
This text provides information on the recommended Ticagrelor doses when taken with interacting drugs such as Simvastatin, Atorvastatin, Levonorgestrel, Ethinyl Estradiol, Tolbutamide, Digoxin, Cyclosporine, and others. It also includes recommendations for dose adjustments and monitoring when combining these drugs with Ticagrelor.*
FDA Label Image

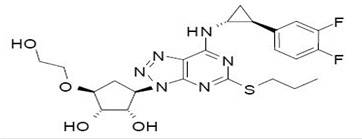
Structure (Ticagrelor Structure)

FDA Label Image

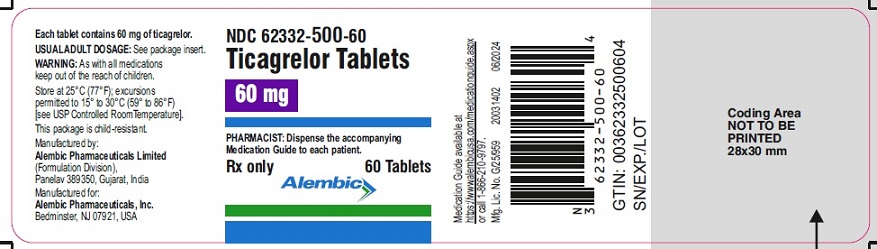
60 Tablets (Ticagrelor Tabs 60 mg)

60 Tablets (Ticagrelor Tabs 60 mg)
This text provides dosage information for the medication Ticagrelor Tablets, along with instructions for pharmacists for dispensing the medication to patients. It includes details like the company information, dosage, and a product code (GTIN: 00362332500604).*
FDA Label Image

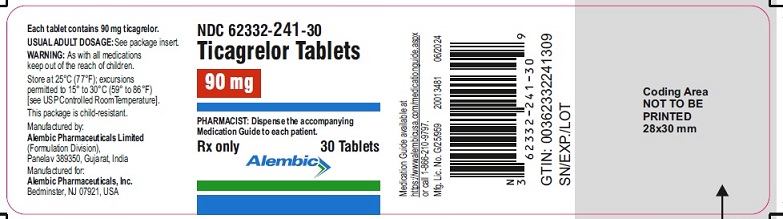
30 Tablets (Ticagrelor Tabs 90 mg)

* These product label images have been analyzed using experimental machine learning. Please verify findings with the primary label text.