Jardiance Tablet, Film Coated
Product Images NDC 67296-2324

View Photos of Packaging, Regulatory Labels, and Product Appearance

Product Visual Gallery

This gallery contains 18 technical images submitted to the FDA as part of the official labeling for Jardiance (NDC 67296-2324). Unlike standard consumer photos, these assets often include clinical data figures, molecular chemical structures, and official manufacturer packaging layouts.

As provided by Redpharm Drug, these visuals offer a comprehensive scientific overview of the product's physical and chemical identity, aiding pharmacists and researchers in product verification and study.

FDA Label Image

Chemical Structure (Jardiance 01)
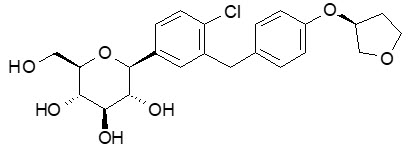
Chemical Structure (Jardiance 01)
Chemical structure of Empagliflozin, the active ingredient in Jardiance 25 mg film-coated tablets. The diagram depicts the molecular arrangement and connectivity of atoms in Empagliflozin.*
FDA Label Image

Figure 1 (Jardiance 02)

Figure 1 (Jardiance 02)
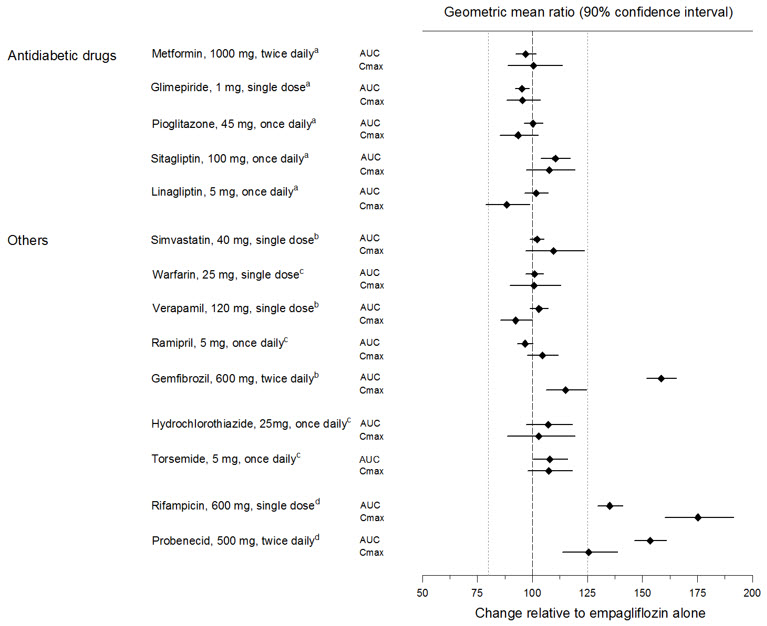
A forest plot chart showing the geometric mean ratio with 90% confidence intervals for the pharmacokinetic parameters AUC and Cmax of various drugs relative to empagliflozin alone. It includes antidiabetic drugs like metformin, glimepiride, pioglitazone, sitagliptin, linagliptin, and other medications such as simvastatin, warfarin, verapamil, ramipril, gemfibrozil, hydrochlorothiazide, torsemide, rifampicin, and probenecid, illustrating changes in drug exposure when coadministered with empagliflozin.*
FDA Label Image

Figure 2 (Jardiance 03)

Figure 2 (Jardiance 03)
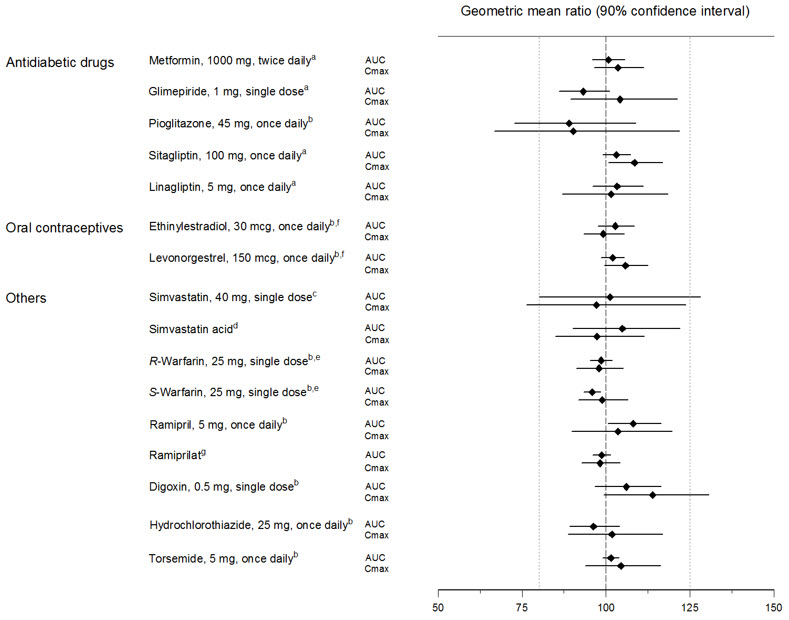
A forest plot chart depicting the geometric mean ratio with 90% confidence intervals for various drugs, including antidiabetic drugs (Metformin, Glimepiride, Pioglitazone, Sitagliptin, Linagliptin), oral contraceptives (Ethinylestradiol, Levonorgestrel), and others (Simvastatin, Simvastatin acid, R-Warfarin, S-Warfarin, Ramipril, Ramiprilat, Digoxin, Hydrochlorothiazide, Torsemide). The chart compares AUC and Cmax values for each drug, shown with dots and error bars along a horizontal axis ranging from 50 to 150.*
FDA Label Image

Figure 3 (Jardiance 04)

Figure 3 (Jardiance 04)
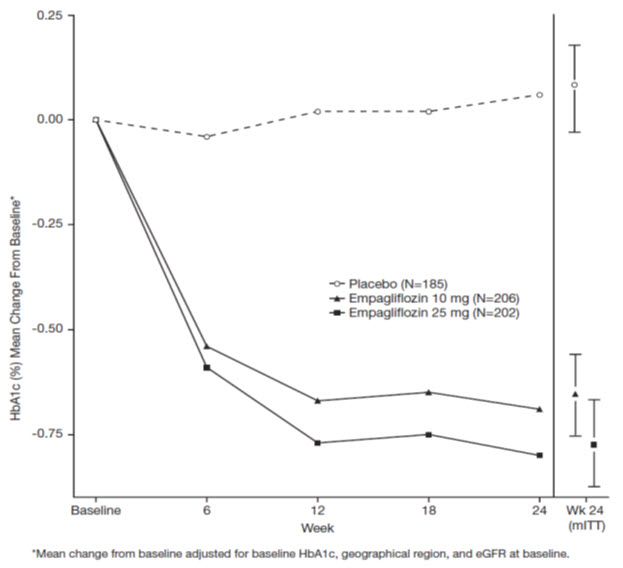
A line graph depicting the mean change from baseline in HbA1c (%) over 24 weeks for placebo, Empagliflozin 10 mg, and Empagliflozin 25 mg groups. The x-axis represents weeks from baseline to week 24, and the y-axis shows HbA1c change percentages. Empagliflozin 25 mg shows the greatest reduction, followed by 10 mg, compared to placebo, which shows no significant change. Error bars display variability at week 24.*
FDA Label Image

Figure 4 (Jardiance 05)

Figure 4 (Jardiance 05)
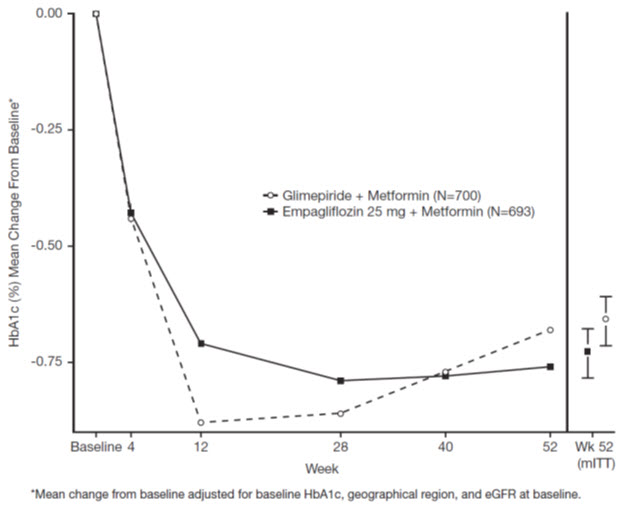
A line graph comparing the mean change from baseline HbA1c (%) over 52 weeks for treatments Glimepiride + Metformin and Empagliflozin 25 mg + Metformin. The X-axis represents weeks, and the Y-axis shows mean HbA1c change. Both treatments show a decrease initially, with Glimepiride + Metformin showing a sharper early decline but an increase near week 52, whereas Empagliflozin 25 mg + Metformin exhibits a steadier decline, maintaining lower HbA1c levels at week 52. The graph includes error bars at week 52 (mITT population).*
FDA Label Image

Figure 5 (Jardiance 06)

Figure 5 (Jardiance 06)
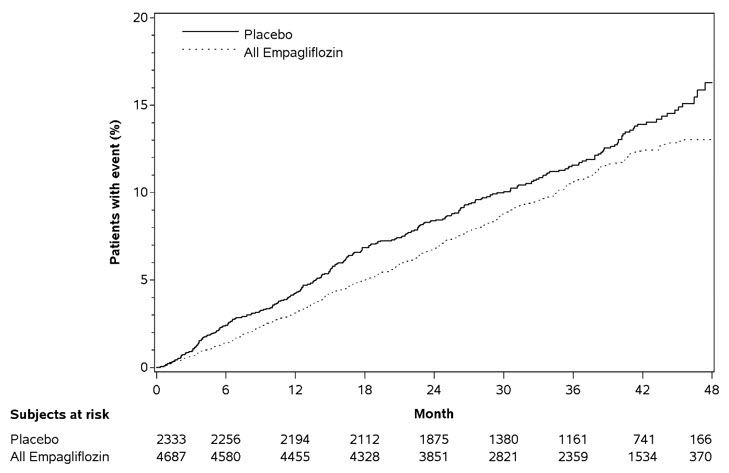
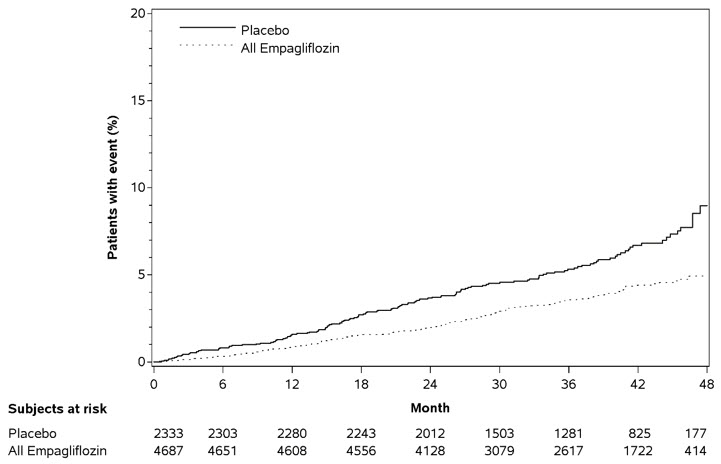
A line graph comparing the percentage of patients with events over 48 months between placebo and all Empagliflozin groups. The chart includes a legend and a table displaying the number of subjects at risk for each group at specified time points.*
FDA Label Image

Figure 6 (Jardiance 07)

Figure 6 (Jardiance 07)
This line graph compares the percentage of patients experiencing an event over 48 months between placebo and empagliflozin treatment groups. The x-axis represents time in months, and the y-axis shows the percentage of patients with the event. A table below the graph lists the number of subjects at risk in each group at various time points.*
FDA Label Image

Figure 7 (Jardiance 08a)

Figure 7 (Jardiance 08a)
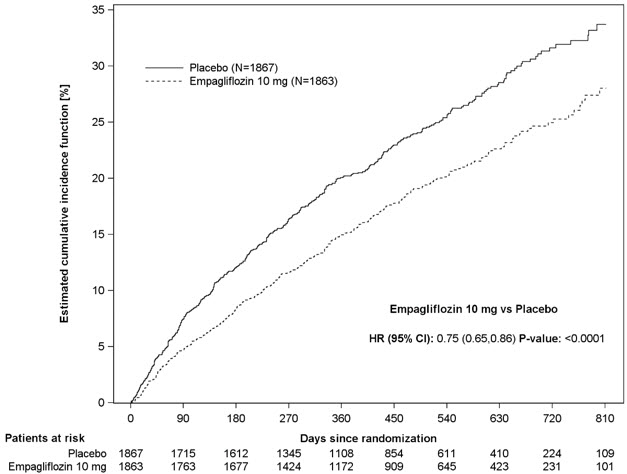
A Kaplan-Meier curve chart showing estimated cumulative incidence percentage over days since randomization, comparing placebo (solid line) with Empagliflozin 10 mg (dotted line). The chart includes patient counts at risk over time and a hazard ratio with confidence interval and p-value for Empagliflozin 10 mg versus placebo.*
FDA Label Image

Figure 8 (Jardiance 08b)

Figure 8 (Jardiance 08b)
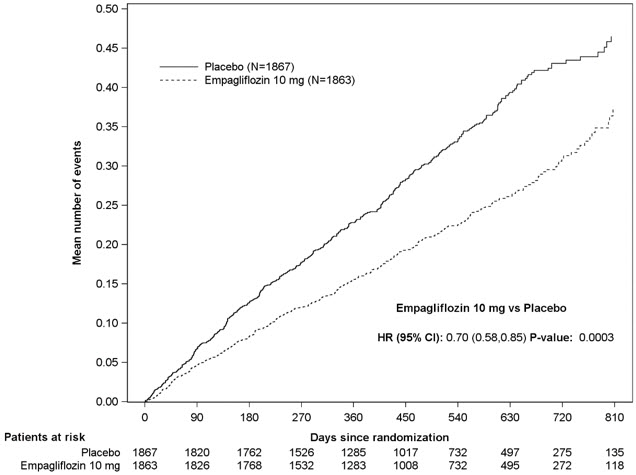
A line graph comparing the mean number of events over days since randomization between a placebo group and an empagliflozin 10 mg group. The graph shows two lines with the placebo group having a higher mean number of events over time. The patient risk numbers for each group are listed below the x-axis at various time points.*
FDA Label Image

Figure 9 (Jardiance 08c)

Figure 9 (Jardiance 08c)
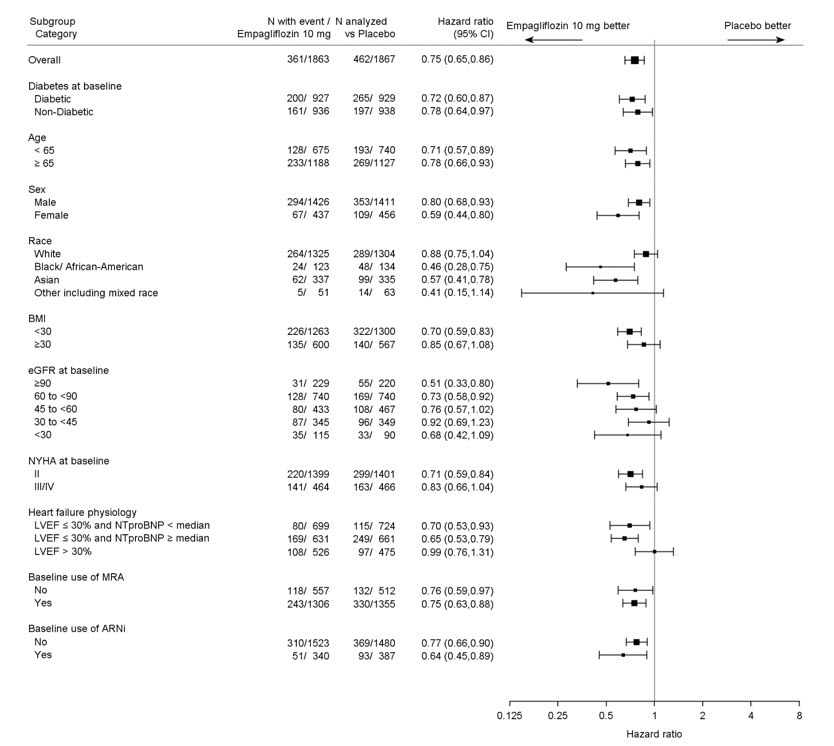
A forest plot comparing hazard ratios of empagliflozin 10 mg versus placebo across various subgroups including diabetes status, age, sex, race, BMI, eGFR at baseline, NYHA class, heart failure physiology, and baseline medication use. The plot displays hazard ratios with 95% confidence intervals, visually illustrating where empagliflozin or placebo is favored within each subgroup.*
FDA Label Image

Figure 10 (Jardiance 08d)

Figure 10 (Jardiance 08d)
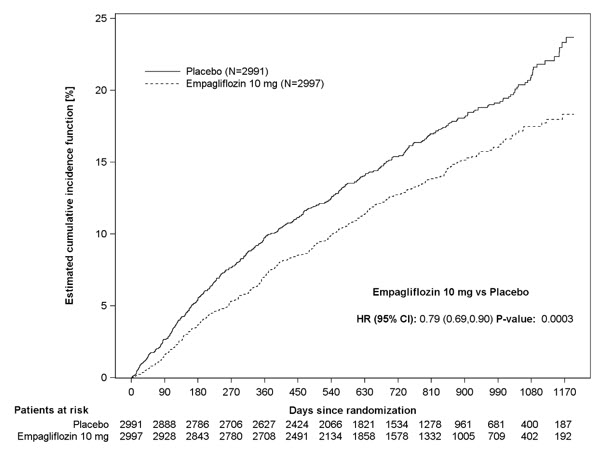
A line graph comparing the estimated cumulative incidence function over days since randomization for patients taking placebo versus Empagliflozin 10 mg. The x-axis represents days since randomization up to 1170 days, and the y-axis shows the cumulative incidence percentage up to 25%. The graph includes a risk table below showing the number of patients at risk for each group over time, with statistical results (HR, 95% CI, and p-value) displayed within the graph.*
FDA Label Image

Figure 11 (Jardiance 08e)

Figure 11 (Jardiance 08e)
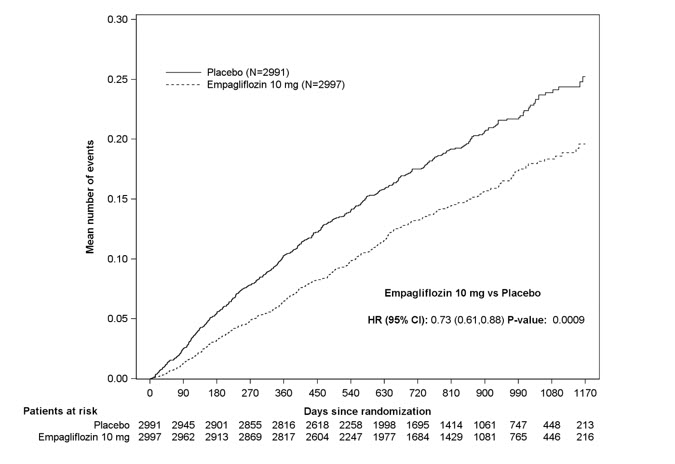
A Kaplan-Meier curve comparing the mean number of events over days since randomization between placebo and Empagliflozin 10 mg groups. The graph shows separate lines for placebo and Empagliflozin 10 mg, with the number of patients at risk at various time points indicated below the x-axis. The hazard ratio (HR) and p-value for Empagliflozin 10 mg versus placebo are noted on the chart.*
FDA Label Image

Figure 12 (Jardiance 08f)

Figure 12 (Jardiance 08f)
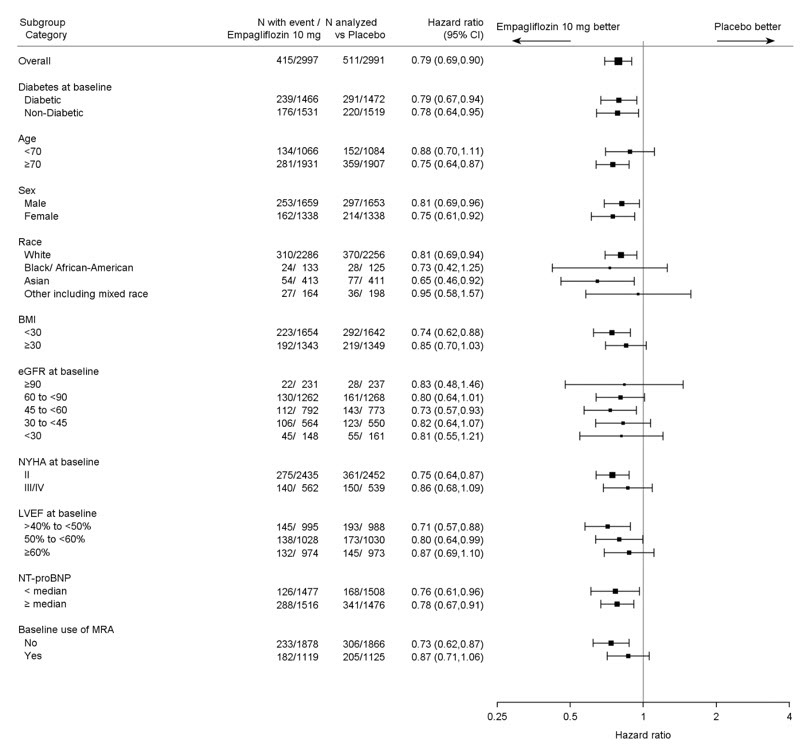
A forest plot chart showing hazard ratios comparing empagliflozin 10 mg versus placebo across various subgroups (diabetes status, age, sex, race, BMI, eGFR, NYHA class, LVEF, NT-proBNP levels, and baseline use of MRA). It includes hazard ratios with 95% confidence intervals and sample event counts for each subgroup, illustrating comparative efficacy outcomes.*
FDA Label Image

Figure 13 (Jardiance 08g)

Figure 13 (Jardiance 08g)
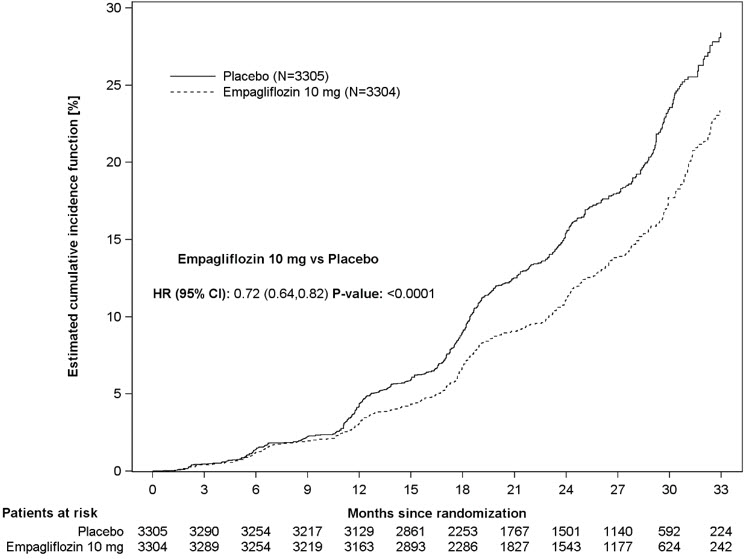
A cumulative incidence function graph comparing Empagliflozin 10 mg and placebo groups over 33 months. The y-axis shows estimated cumulative incidence function percentage, and the x-axis shows months since randomization. The chart includes numbers of patients at risk for each group at specified intervals and statistical data for Empagliflozin 10 mg versus placebo, including hazard ratio and p-value.*
FDA Label Image

Figure 14 (Jardiance 08h)

Figure 14 (Jardiance 08h)
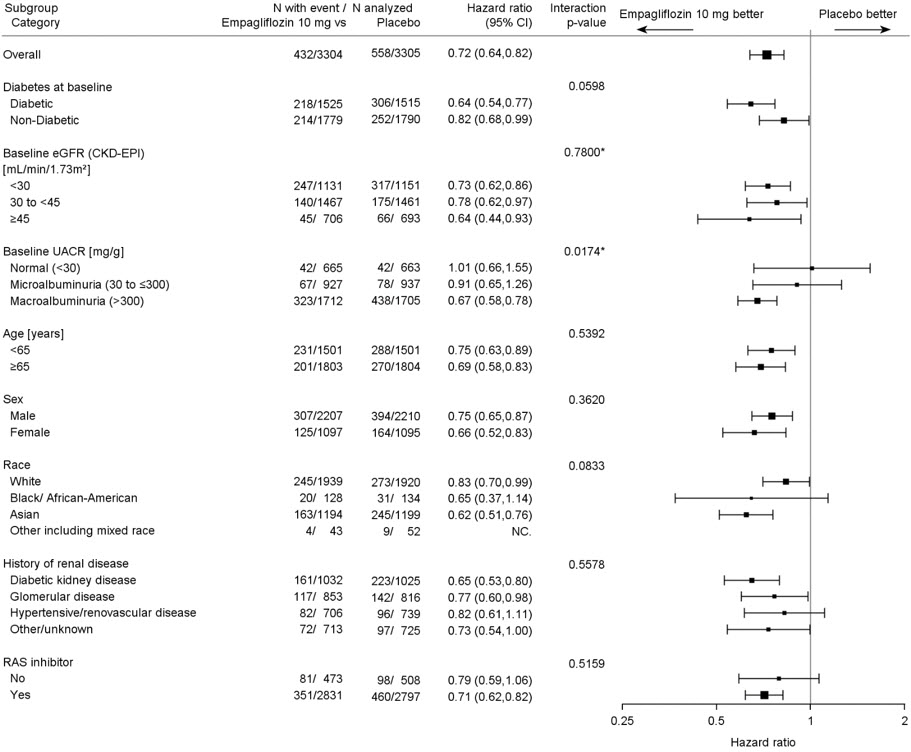
A forest plot chart showing hazard ratios with 95% confidence intervals comparing Empagliflozin 10 mg to placebo across various subgroups, including diabetes status, baseline kidney function measures (eGFR and UACR), age, sex, race, history of renal disease, and use of RAS inhibitors.*
FDA Label Image

Qr Code (Jardiance 08i)

Qr Code (Jardiance 08i)
Jardiance 25 mg film-coated oral tablets packaging label by Redpharm Drug. The carton prominently shows the proprietary name Jardiance, with the dosage strength of 25 mg visible. The labeler name Redpharm Drug is displayed, along with a product NDC code 67296-2324. The packaging includes dosage form and route information, emphasizing the product as a human prescription drug.*
FDA Label Image

Principal Display Panel (10 mg Tablet Blister Card Carton)

Principal Display Panel (10 mg Tablet Blister Card Carton)
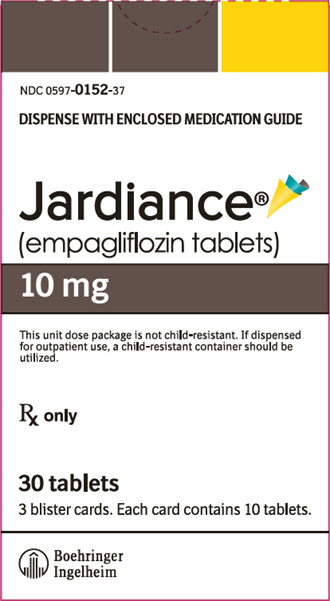
Packaging label for Jardiance 10 mg film-coated tablets containing empagliflozin. The label indicates the package contains 30 tablets in three blister cards of 10 tablets each. It states the product is prescription only and includes a warning about child-resistant packaging. The labeler is Boehringer Ingelheim, with an NDC different from the provided data.*
FDA Label Image

Principal Display Panel (25 mg Tablet Blister Card Carton)

Principal Display Panel (25 mg Tablet Blister Card Carton)
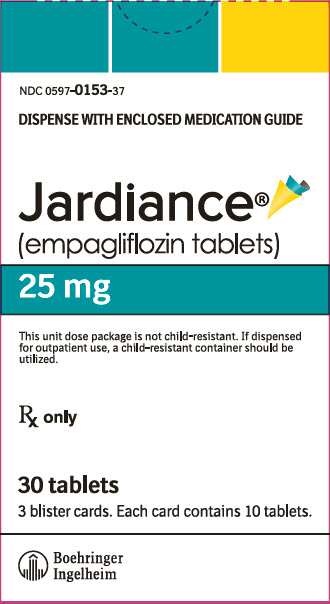
Packaging label for Jardiance (empagliflozin) 25 mg film-coated tablets. The unit dose package contains 30 tablets divided into three blister cards of 10 tablets each. The label notes it is for prescription use only and advises dispensing with the enclosed medication guide. Manufactured by Boehringer Ingelheim.*

* About these descriptions: Image descriptions on this page are generated by automated AI analysis of the product label images from the manufacturer's FDA label submission (SPL). They are provided for reference only and may contain errors or omissions. Always rely on the printed label itself and the official FDA labeling, and consult a pharmacist or healthcare professional with any questions about this product.