Vyepti Injection
Product Images NDC 67386-130

9 FDA label images from Lundbeck Pharmaceuticals Llc · Packaging, Regulatory Labels, and Product Appearance

Product Visual Gallery

This gallery contains 9 technical images submitted to the FDA as part of the official labeling for Vyepti (NDC 67386-130). Unlike standard consumer photos, these assets often include clinical data figures, molecular chemical structures, and official manufacturer packaging layouts.

As provided by Lundbeck Pharmaceuticals Llc, these visuals offer a comprehensive scientific overview of the product's physical and chemical identity, aiding pharmacists and researchers in product verification and study.

FDA Label Image

Figure 1. Change From Baseline In Monthly Migraine Days In Study 1 (Vyepti 1)
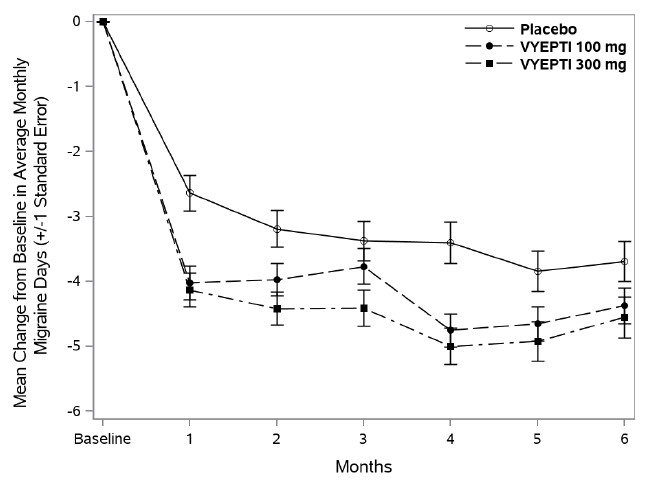
Figure 1. Change From Baseline In Monthly Migraine Days In Study 1 (Vyepti 1)
Line graph showing the mean change from baseline in average monthly migraine days over 6 months. The graph compares placebo, Vyepti 100 mg, and Vyepti 300 mg groups, with the vertical axis representing the change in migraine days and the horizontal axis representing months. Both Vyepti doses show greater reductions in migraine days compared to placebo over time.*
FDA Label Image

Figure 2. Distribution Of Change From Baseline In Mean Monthly Migraine Days Over Months 1 To 3 By Treatment Group In Study 1 (Vyepti 2)

Figure 2. Distribution Of Change From Baseline In Mean Monthly Migraine Days Over Months 1 To 3 By Treatment Group In Study 1 (Vyepti 2)
Bar chart showing the percentage of patients with fewer migraine days per month for three groups: Placebo (N=222), VYEPTI 100 mg Quarterly (N=221), and VYEPTI 300 mg Quarterly (N=222). The x-axis categorizes the reduction in migraine days by intervals from '>12 to 14' down to '>0 to 2', including a category for no change or more migraine days per month. The y-axis represents the percentage of patients, ranging from 0 to 30%.*
FDA Label Image

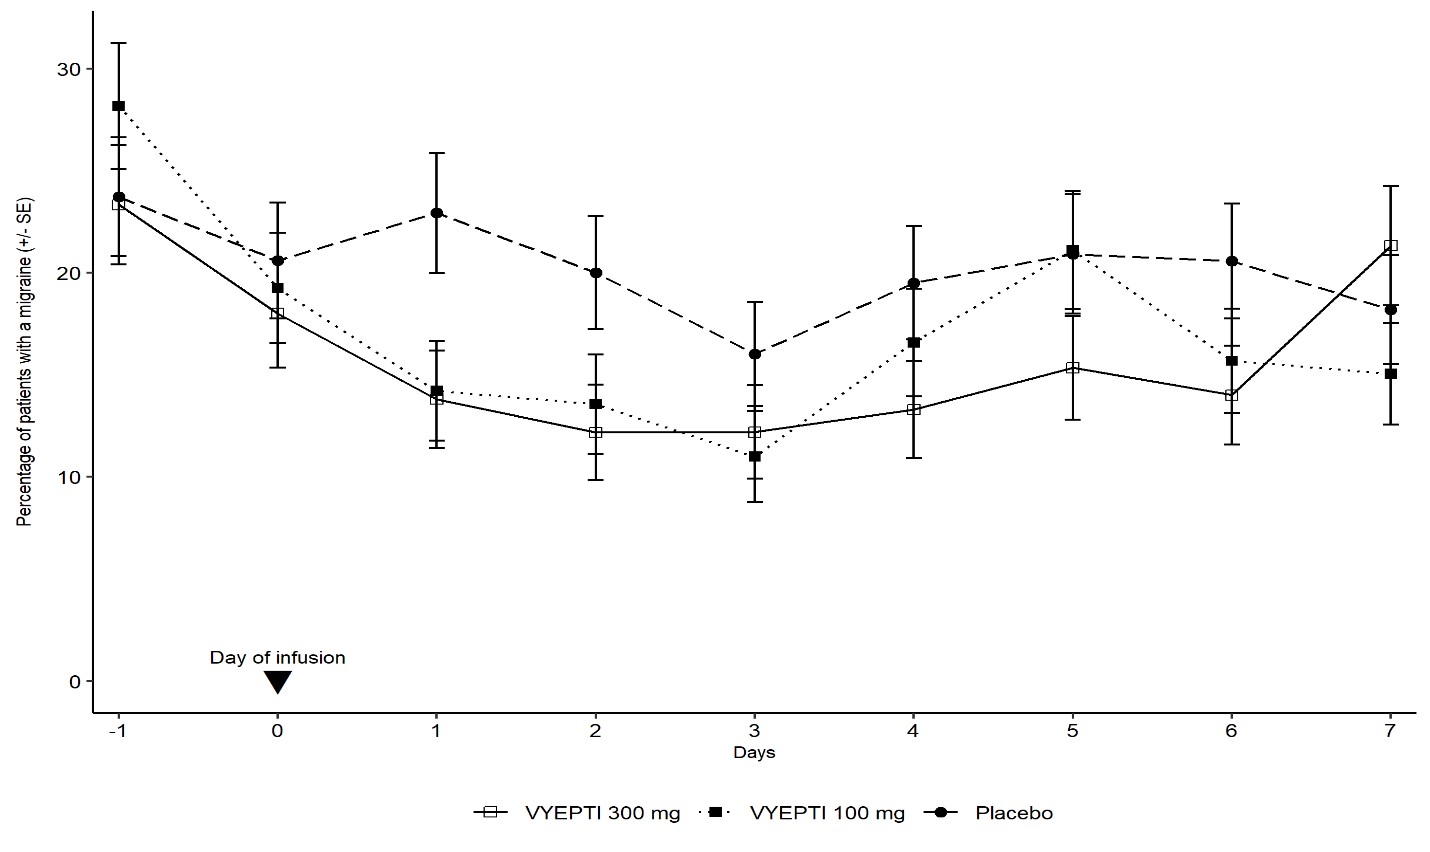
Figure 3. Percentage Of Patients With A Migraine From Day -1 (day Prior To Infusion) To Day 7 In Study 1 (Vyepti 3)

Figure 3. Percentage Of Patients With A Migraine From Day -1 (day Prior To Infusion) To Day 7 In Study 1 (Vyepti 3)
A line graph showing the percentage of patients with a migraine (+/- SE) over days from -1 to 7, comparing three groups: VYEPTI 300 mg, VYEPTI 100 mg, and placebo. The x-axis represents days and the y-axis shows the percentage of patients. The day of infusion is marked at day 0. Data points for each group are connected with different line styles and markers.*
FDA Label Image

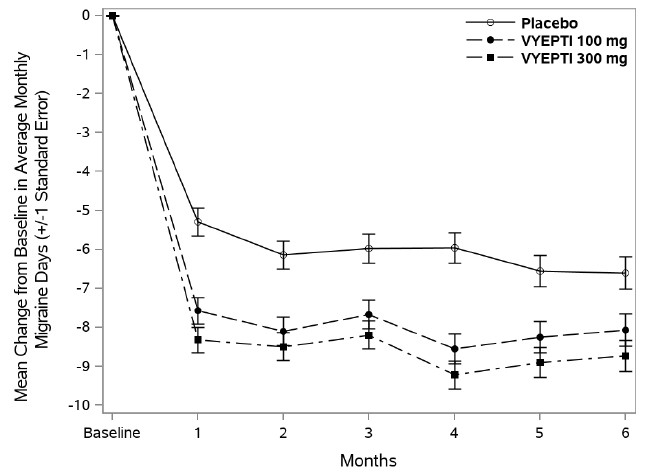
Figure 4. Change From Baseline In Monthly Migraine Days In Study 2 (Vyepti 4)

Figure 4. Change From Baseline In Monthly Migraine Days In Study 2 (Vyepti 4)
A line graph showing mean change from baseline in average monthly migraine days over six months, comparing Placebo, VYEPTI 100 mg, and VYEPTI 300 mg groups. The graph includes error bars for standard error, with monthly time points on the x-axis and mean change in migraine days on the y-axis.*
FDA Label Image

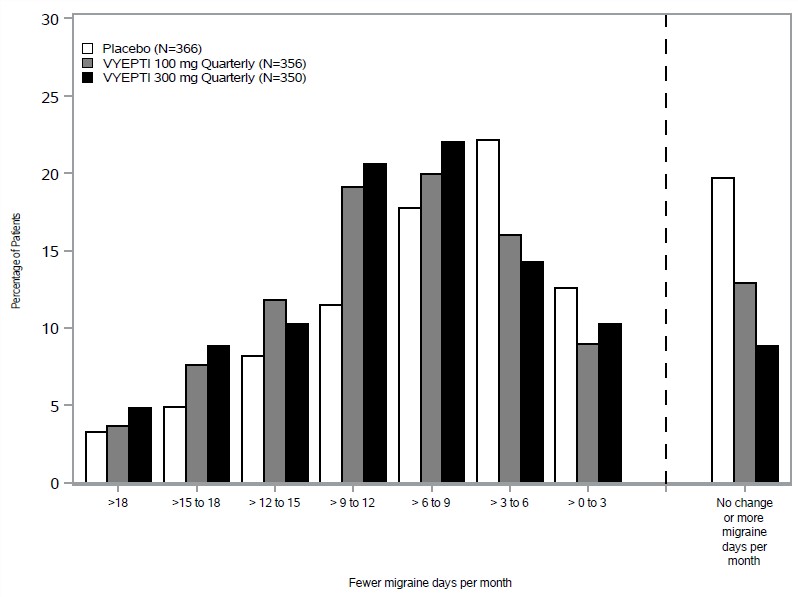
Figure 5. Distribution Of Change From Baseline In Mean Monthly Migraine Days Over Months 1-3 By Treatment Group In Study 2 (Vyepti 5)

Figure 5. Distribution Of Change From Baseline In Mean Monthly Migraine Days Over Months 1-3 By Treatment Group In Study 2 (Vyepti 5)
A bar chart illustrating the distribution of patients by percentage experiencing fewer migraine days per month, comparing placebo, Vyepti 100 mg quarterly, and Vyepti 300 mg quarterly groups. The x-axis shows intervals of migraine day reduction, and the y-axis shows the percentage of patients. A dashed vertical line separates patients with migraine day reduction from those with no change or more migraine days per month.*
FDA Label Image

Figure 6. Percentage Of Patients With A Migraine From Day -1 (day Prior To Infusion) To Day 7 In Study 2 (Vyepti 6)

Figure 6. Percentage Of Patients With A Migraine From Day -1 (day Prior To Infusion) To Day 7 In Study 2 (Vyepti 6)
A line graph depicting the percentage of patients with a migraine (± standard error) over a period of days from -1 to 7. The graph compares three groups: VYEPTI 300 mg, VYEPTI 100 mg, and placebo. A marker indicates the day of infusion at day 0. The graph shows a decline in migraine percentage after infusion for both VYEPTI doses compared to placebo, with error bars displayed for each data point.*
FDA Label Image

Lundbeck Logo 1 (Vyepti 7)

FDA Label Image

Lundbeck (Vyepti 8)

FDA Label Image

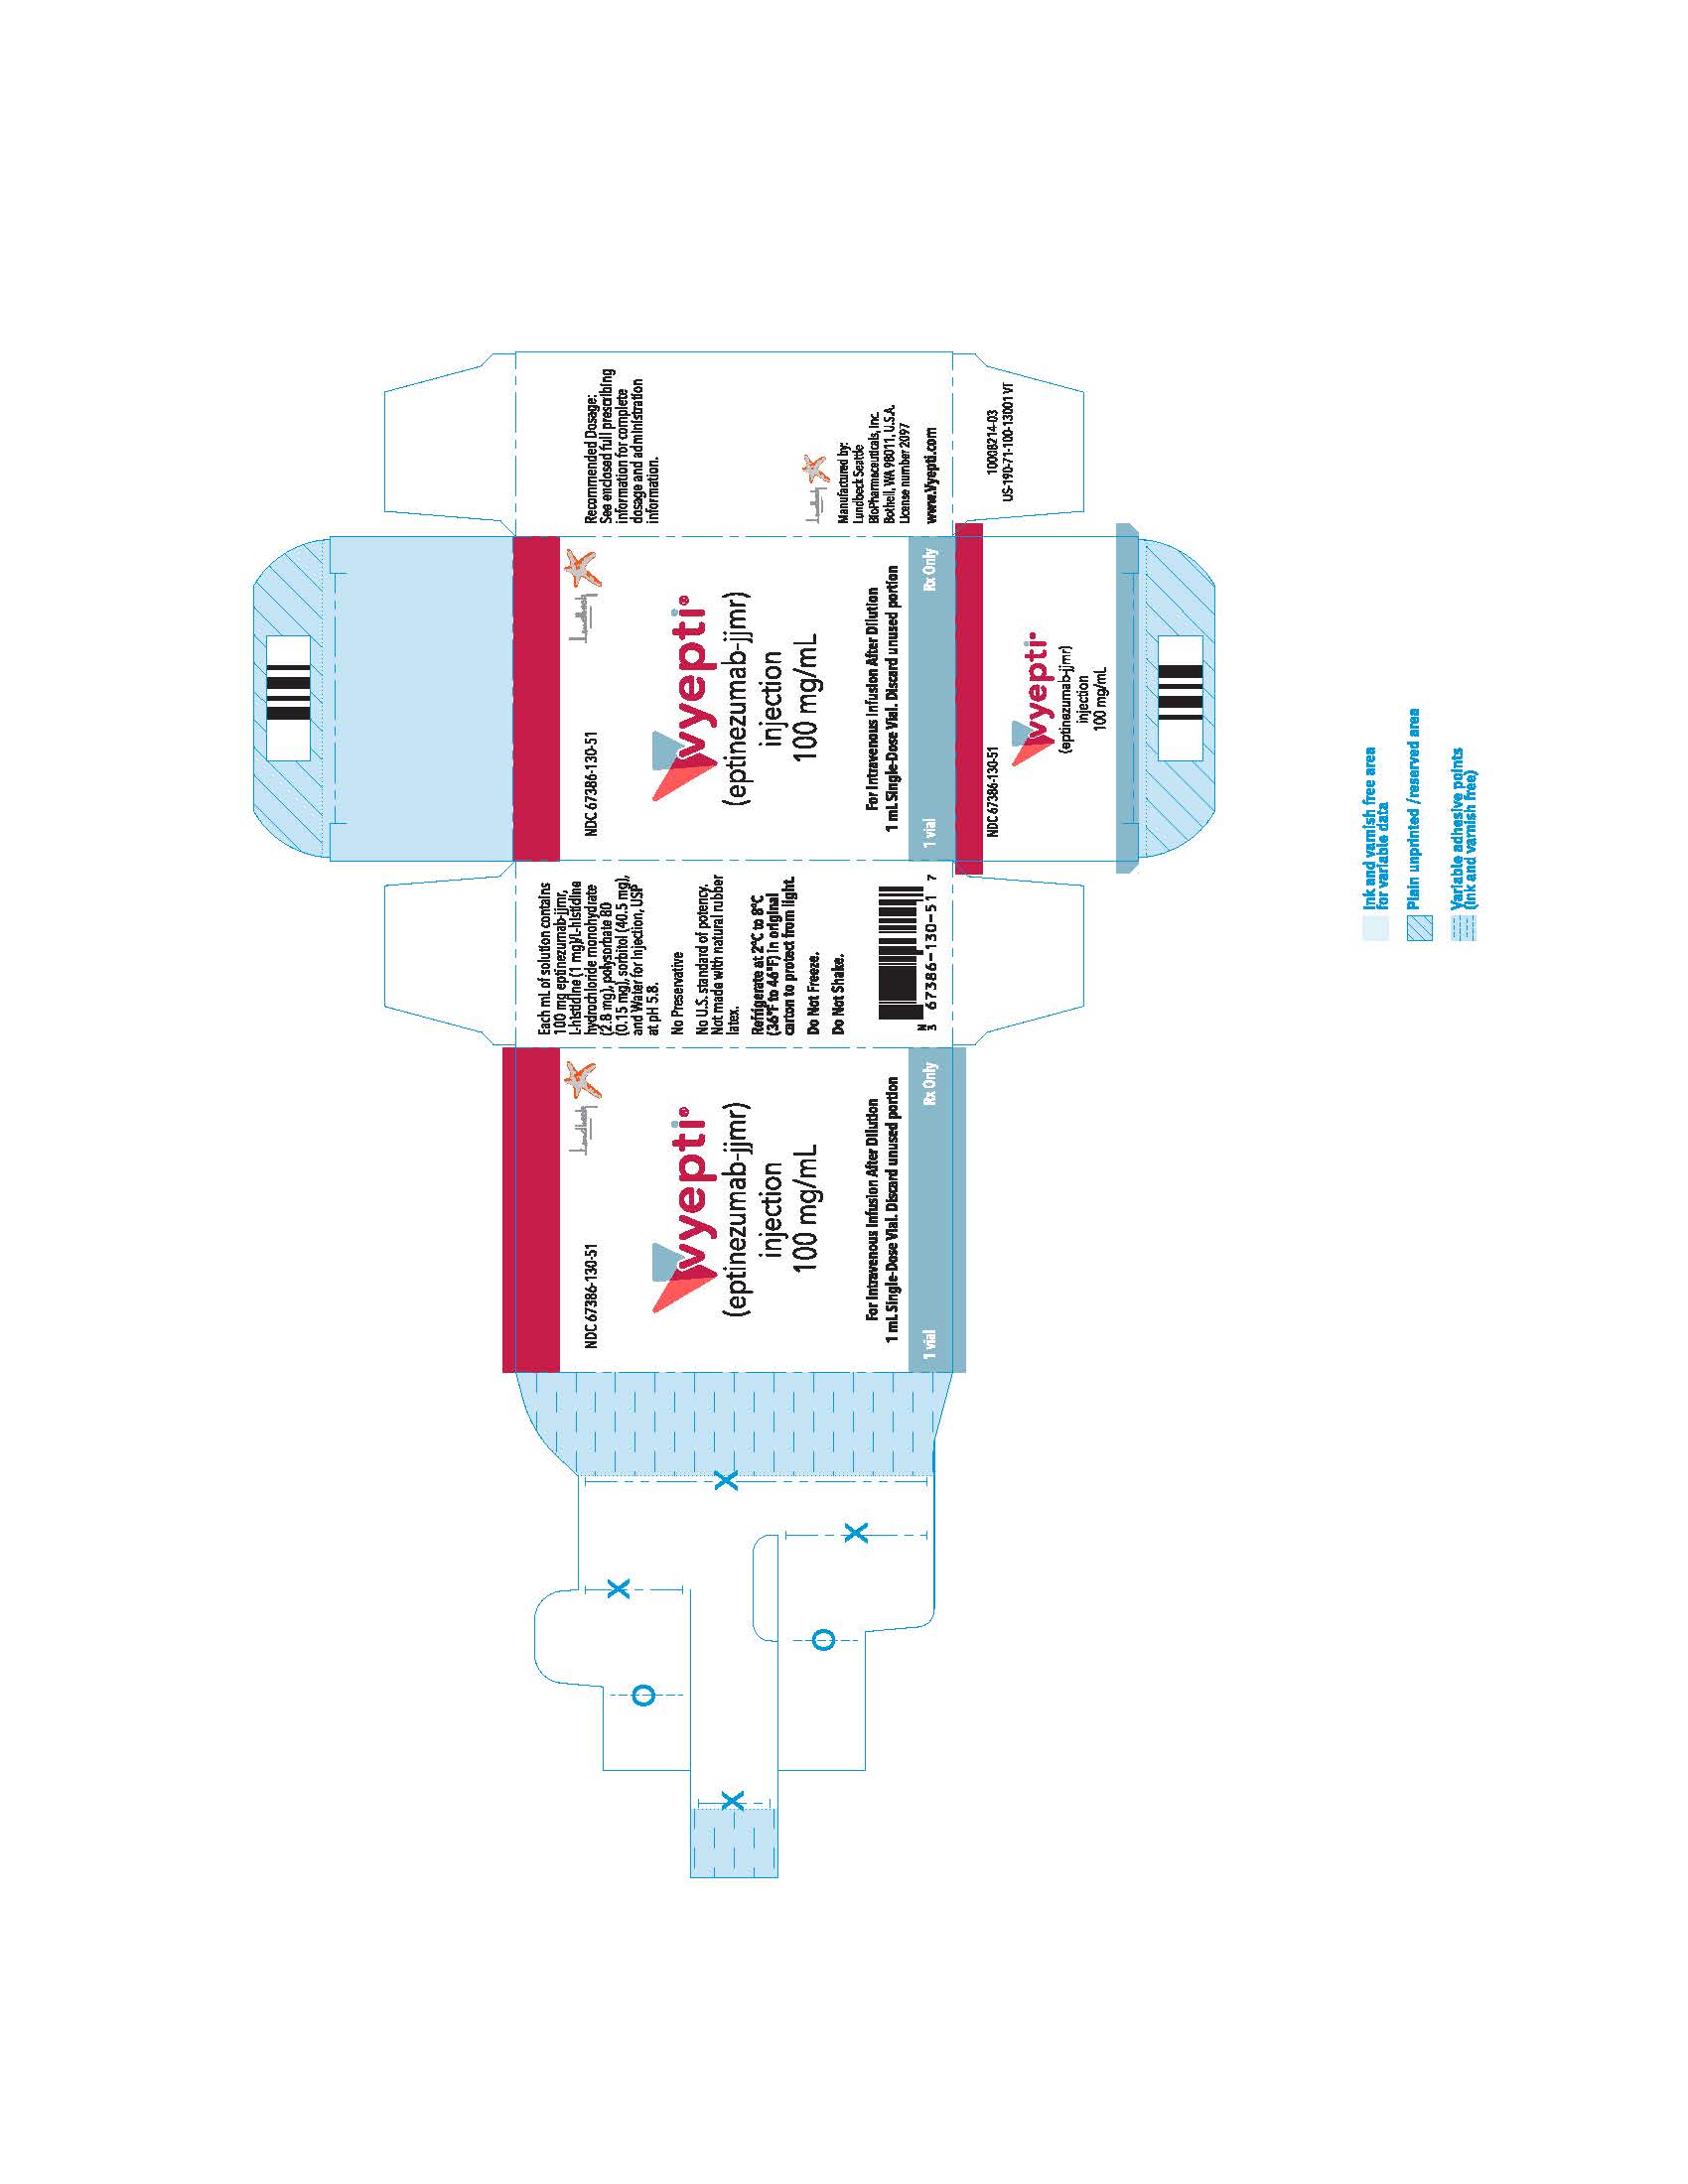
Ndc 67386-130-51 Vyeptitm (vye Ep' Tee) (eptinezumab-jjmr) Injection, For Intravenous Use 100 mg/ml Injection, For Intravenous Use 100 mg/ml (Vyepti 9)

Ndc 67386-130-51 Vyeptitm (vye Ep' Tee) (eptinezumab-jjmr) Injection, For Intravenous Use 100 mg/ml Injection, For Intravenous Use 100 mg/ml (Vyepti 9)
Packaging label for Vyepti (eptinezumab-jjmr) injection, 100 mg/mL, an intravenous injection product by Lundbeck Pharmaceuticals LLC. The label includes information on dosage, storage, single-dose vial usage, barcodes, and manufacturer details. The design features the product name prominently with red and blue color accents and the Lundbeck Pharmaceuticals logo.*

* About these descriptions: Image descriptions on this page are generated by automated AI analysis of the product label images from the manufacturer's FDA label submission (SPL). They are provided for reference only and may contain errors or omissions. Always rely on the printed label itself and the official FDA labeling, and consult a pharmacist or healthcare professional with any questions about this product.