Levetiracetam Injection
Product Images NDC 67457-265

8 FDA label images from Mylan Institutional Llc · Packaging, Regulatory Labels, and Product Appearance

Product Visual Gallery

This gallery contains 8 technical images submitted to the FDA as part of the official labeling for Levetiracetam (NDC 67457-265). Unlike standard consumer photos, these assets often include clinical data figures, molecular chemical structures, and official manufacturer packaging layouts.

As provided by Mylan Institutional Llc, these visuals offer a comprehensive scientific overview of the product's physical and chemical identity, aiding pharmacists and researchers in product verification and study.

FDA Label Image

Levetiracetam Injection 500 mg/100 mL Carton Label (Image 01)
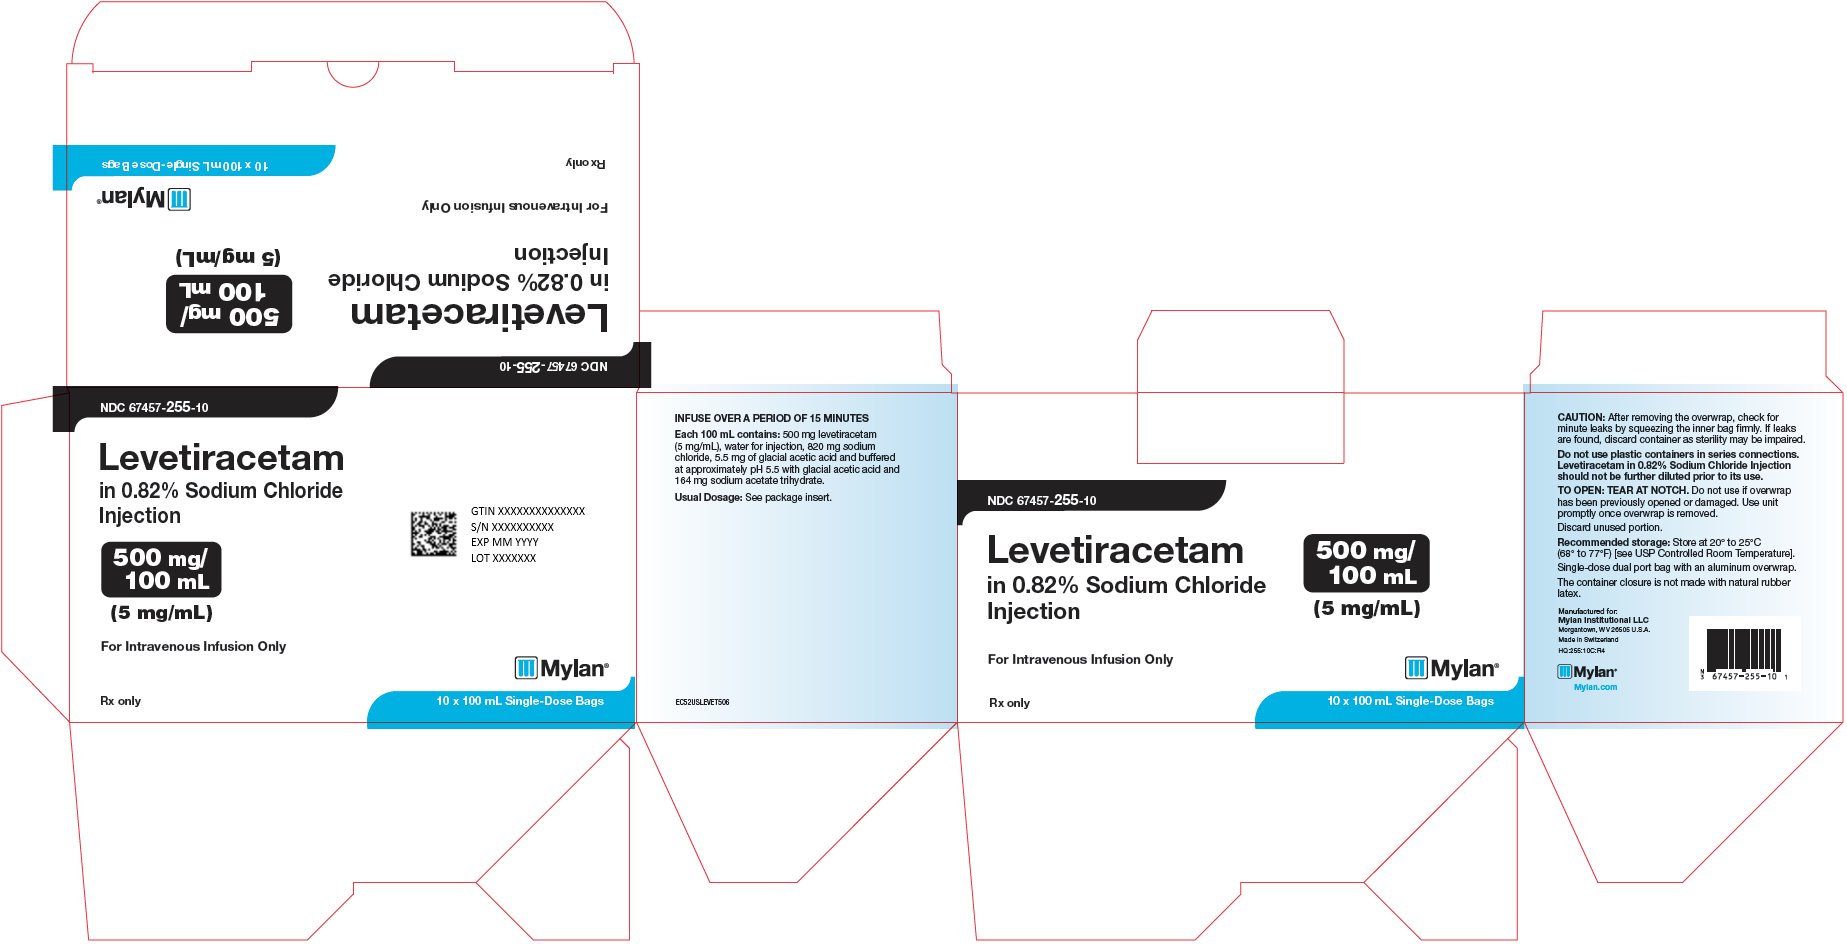
Levetiracetam Injection 500 mg/100 mL Carton Label (Image 01)
Levetiracetam 500 mg/100 mL (5 mg/mL) injection in 0.82% Sodium Chloride for intravenous infusion only. The unfolded carton label indicates it is supplied by Mylan Institutional LLC as 10 single-dose 100 mL bags. The label includes dosage and storage instructions and cautions against multiple uses or container damage.*
FDA Label Image

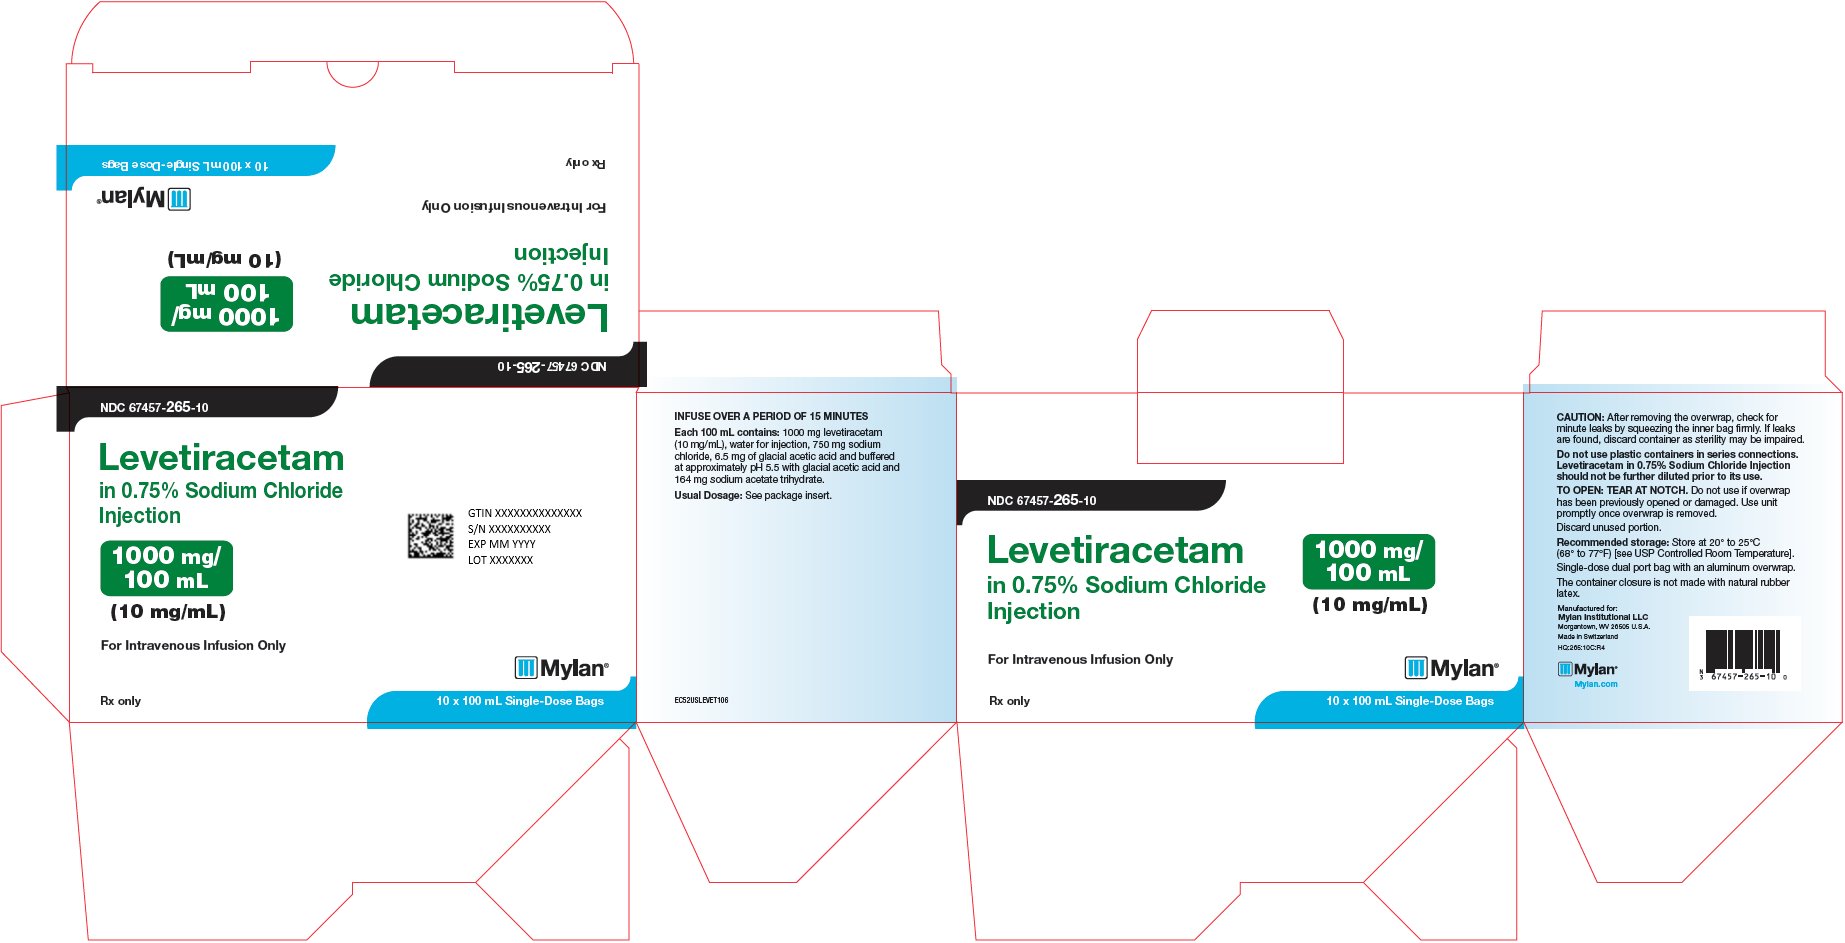
Levetiracetam Injection 1000 mg/100 mL Carton Label (Image 02)

Levetiracetam Injection 1000 mg/100 mL Carton Label (Image 02)
Packaging label for Levetiracetam Injection in 0.75% Sodium Chloride, 1000 mg/100 mL (10 mg/mL), for intravenous infusion only. The product is supplied by Mylan Institutional LLC in 10 x 100 mL single-dose bags. The label includes dosing and storage instructions, with NDC 67457-265-10 visible.*
FDA Label Image

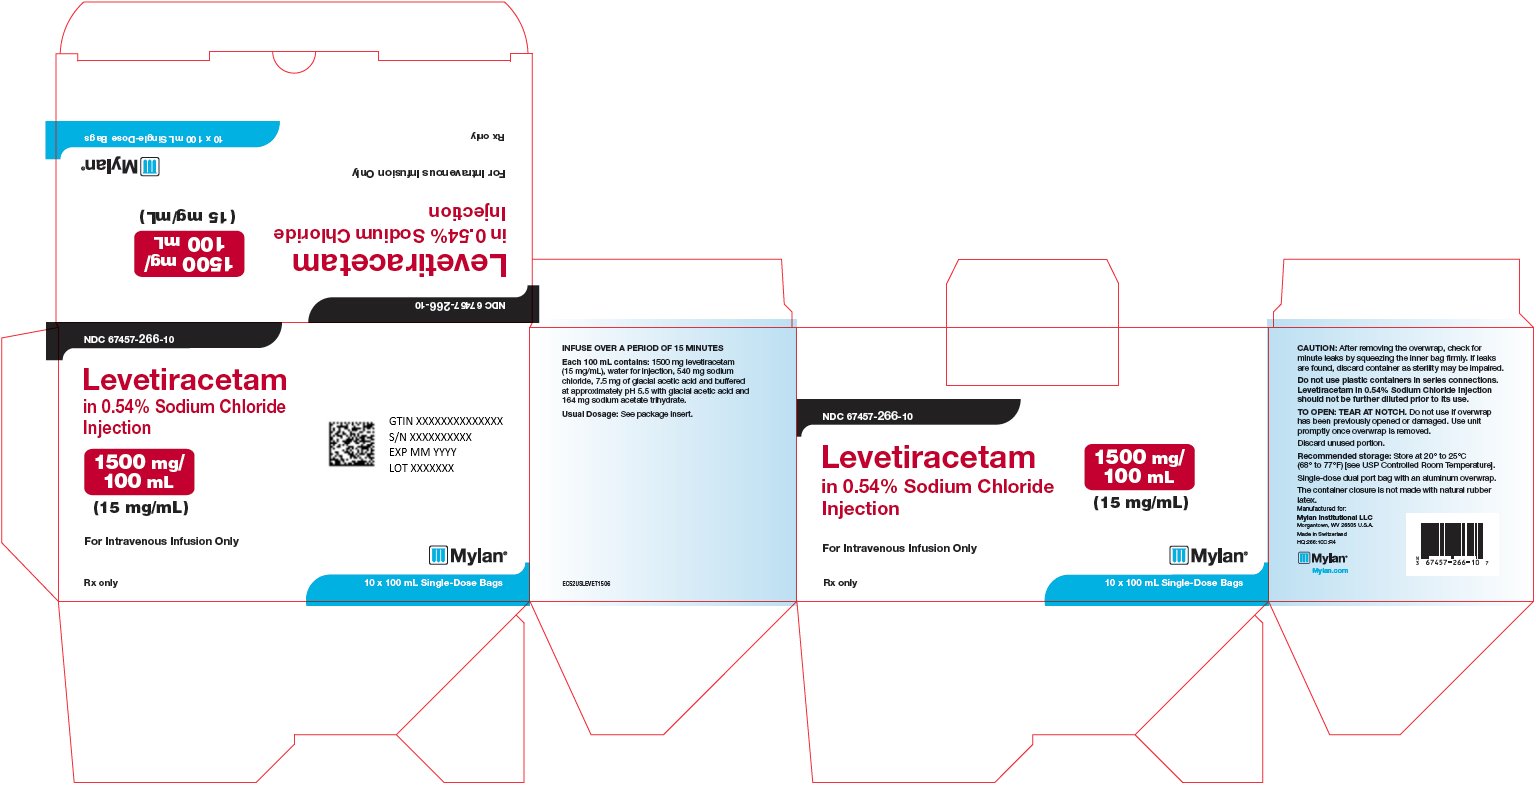
Levetiracetam Injection 1500 mg/100 mL Carton Label (Image 03)

Levetiracetam Injection 1500 mg/100 mL Carton Label (Image 03)
Packaging label for Levetiracetam 1500 mg/100 mL (15 mg/mL) injection in 0.54% Sodium Chloride, by Mylan Institutional LLC. The label indicates the product is for intravenous infusion only, includes 10 single-dose 100 mL bags, and specifies storage, usage instructions, and manufacturer details.*
FDA Label Image

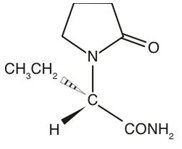
Levetiracetam Structural Formula (Image 04)

Levetiracetam Structural Formula (Image 04)
Chemical structure of Levetiracetam, showing its molecular framework including a pyrrolidone ring and functional groups attached to the central carbon.*
FDA Label Image

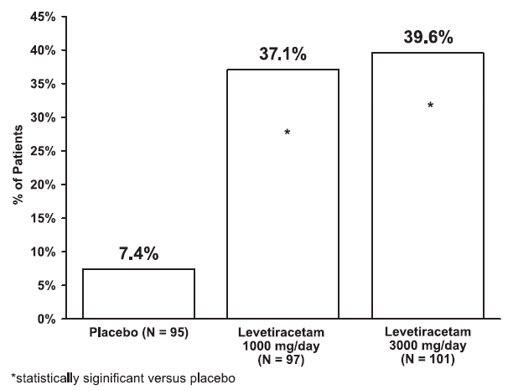
Figure 1: Responder Rate (≥50% Reduction From Baseline) In Study 1 (Image 05)

Figure 1: Responder Rate (≥50% Reduction From Baseline) In Study 1 (Image 05)
A bar graph showing the percentage of patients for placebo and two doses of Levetiracetam (1000 mg/day and 3000 mg/day). The vertical axis represents the percentage of patients from 0% to 45%. The placebo group has 7.4%, Levetiracetam 1000 mg/day has 37.1%, and Levetiracetam 3000 mg/day has 39.6%. An asterisk indicates statistical significance versus placebo.*
FDA Label Image

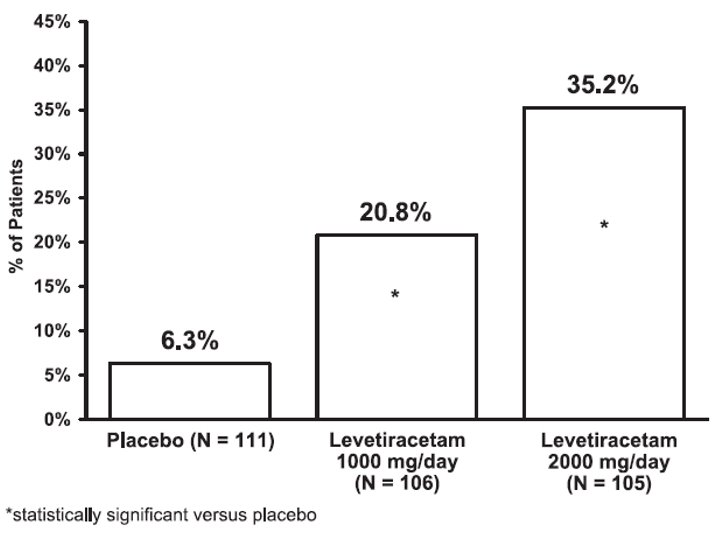
Figure 2: Responder Rate (≥50% Reduction From Baseline) In Study 2: Period A (Image 06)

Figure 2: Responder Rate (≥50% Reduction From Baseline) In Study 2: Period A (Image 06)
A bar chart showing the percentage of patients in three groups: Placebo (6.3%), Levetiracetam 1000 mg/day (20.8%), and Levetiracetam 2000 mg/day (35.2%). The chart compares patient response rates with statistical significance marked for Levetiracetam groups versus placebo.*
FDA Label Image

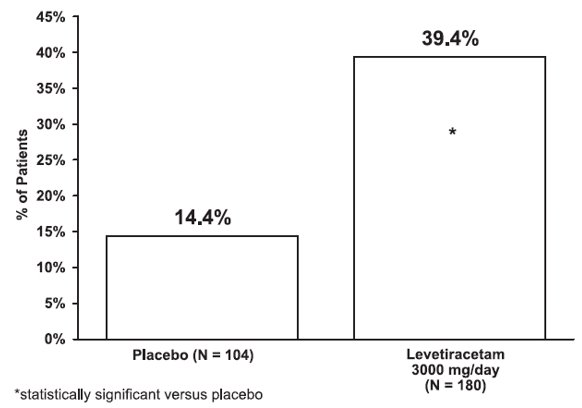
Figure 3: Responder Rate (≥50% Reduction From Baseline) In Study 3 (Image 07)

Figure 3: Responder Rate (≥50% Reduction From Baseline) In Study 3 (Image 07)
A bar graph comparing the percentage of patients between two groups: Placebo (N=104) at approximately 14.4%, and Levetiracetam 3000 mg/day (N=180) at approximately 39.4%. The graph indicates a statistically significant difference with asterisk notation for the Levetiracetam group relative to placebo.*
FDA Label Image

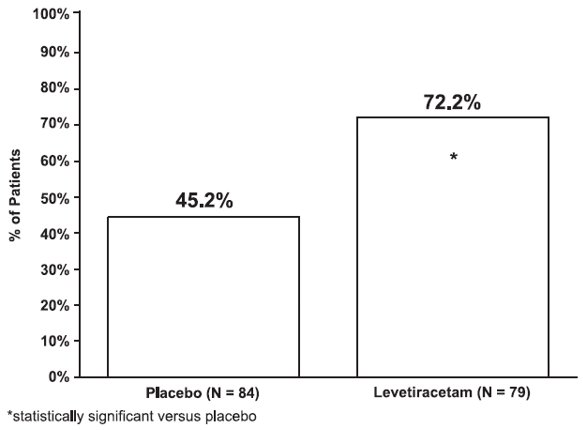
Figure 4: Responder Rate (≥50% Reduction From Baseline) In Pgtc Seizure Frequency Per Week (Image 08)

Figure 4: Responder Rate (≥50% Reduction From Baseline) In Pgtc Seizure Frequency Per Week (Image 08)
A bar chart comparing the percentage of patients between placebo and Levetiracetam groups. The vertical axis represents percentage of patients from 0% to 100%. The placebo group (N=84) shows 45.2%, and the Levetiracetam group (N=79) shows 72.2%, with an asterisk indicating statistical significance versus placebo.*

* About these descriptions: Image descriptions on this page are generated by automated AI analysis of the product label images from the manufacturer's FDA label submission (SPL). They are provided for reference only and may contain errors or omissions. Always rely on the printed label itself and the official FDA labeling, and consult a pharmacist or healthcare professional with any questions about this product.