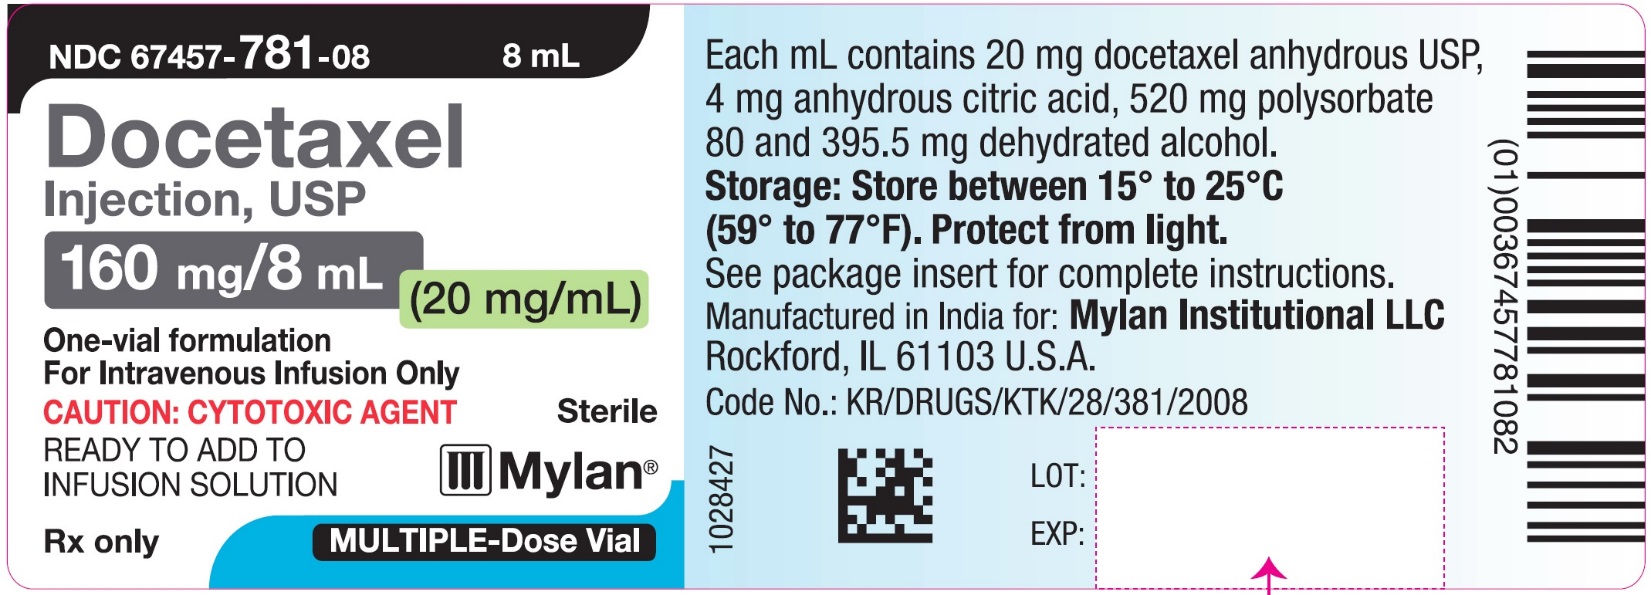
Product Images Docetaxel

View Photos of Packaging, Labels & Appearance

Product Label Images

The following 13 images provide visual information about the product associated with Docetaxel NDC 67457-781 by Mylan Institutional Llc, such as packaging, labeling, and the appearance of the drug itself. This resource could be helpful for medical professionals, pharmacists, and patients seeking to verify medication information and ensure they have the correct product.

Carton MDV - image 01

Carton MDV - image 01

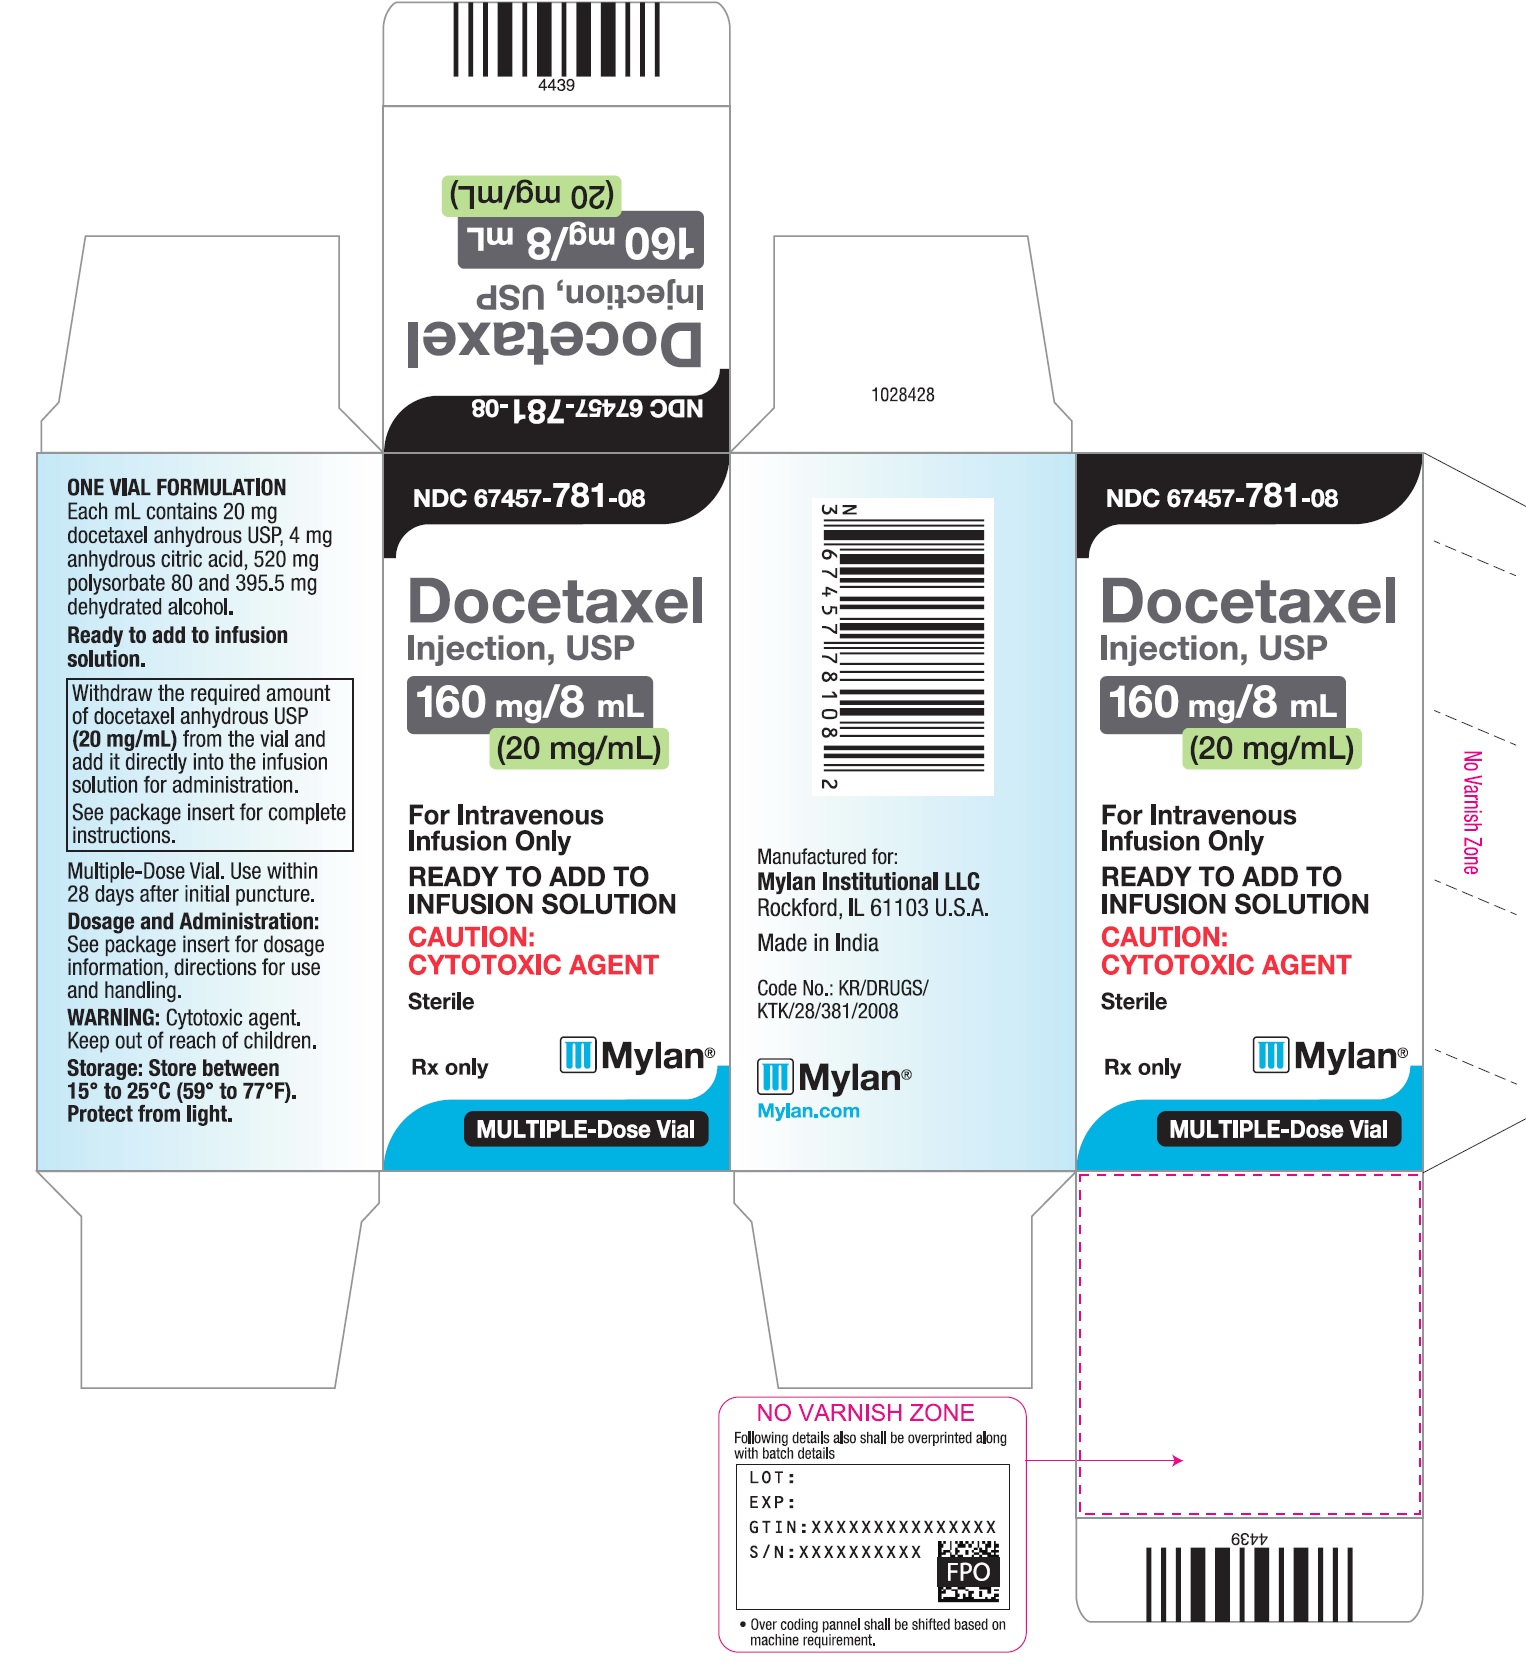
This is a one vial formulation of Docetaxel anhydrous USP in 20mg/mL quantity. Each mL contains 4mg anhydrous citric acid, 520mg polysorbate, and 395.5mg dehydrated alcohol. It is ready to add to infusion solution for administration. The multiple-dose vial must be used within 28 days after the initial puncture. It is a cytotoxic agent, must be kept out of children's reach, and should be stored between 15°C to 25°C (59°F to 77°F) and protected from light. The package insert contains complete instructions which include dosage and administration, directions for use, and handling. Overprinting along with batch details including LOT, EXP, GTINzIXXXXXXXXXXXXXXX, and S/NzZXXXXXXXXXX can be seen.*

Container Label - image 02

Container Label - image 02

NDC 67457-781-08 is a one vial formulation of Docetaxel Injection, USP. It is a cytotoxic agent available for intravenous infusion only, and is to be added to Mylan infusion solution. Each mL of the injection contains 20mg of docetaxel anhydrous USP along with polysorbate 80, dehydrated alcohol and anhydrous citric acid. The storage temperature recommended is between 15 to 25°C. Please refer to the package insert for instructions. The medication is manufactured in India and distributed by Mylan Institutional LLC. Lot number is available in the text.*

Structure - image 03

Structure - image 03

Graph 1 - image 04

Graph 1 - image 04

This text may represent a chart or table showing DFS (Disease Free Survival) probability in percentage (%) over time in months (a8, 24, 30, 54, 60, and 66). However, due to the lack of further information and the errors in the text, a more accurate interpretation cannot be provided.*

Graph 2 - image 05

Graph 2 - image 05

Graph 3 - image 06

Graph 3 - image 06

Graph 4 - image 07

Graph 4 - image 07

The text seems to be a part of a graph or chart displaying the Cumulative probability and Survival time in months. It also includes the overall survival of the period and a Log.rank p value. It is not clear without further context what the numbers 9, 12, 15, 18, and 21 represent.*

Graph 5 - image 08

Graph 5 - image 08

Graph 6 - image 09

Graph 6 - image 09

This is a graph showing probability on the y-axis and time in months on the x-axis. The value of the probability starts at 12%.*

Graph 7 - image 10

Graph 7 - image 10

Graph 8 - image 11

Graph 8 - image 11

Graph 9 - image 12

Graph 9 - image 12

This is a chart that shows the survival probability (in percentage) at different time points (24, 30, 36, and 42 months). The chart does not provide any information on what this data pertains to.*

Graph 10 - image 13

Graph 10 - image 13

This is a graph representing the survival probability (%) of patients in two different groups: TPF (n=255) and PF (n=2248). The X-axis shows the survival time in months and the Y-axis indicates the survival percentage. The graph shows the survival percentage at different time points (0, 6, 12, 18, 24, 30, 36, 42, 48, 54, and 60 months). The number of patients at risk is also shown for each time point.*

* The product label images have been analyzed using a combination of traditional computing and machine learning techniques. It should be noted that the descriptions provided may not be entirely accurate as they are experimental in nature. Use the information in this page at your own discretion and risk.