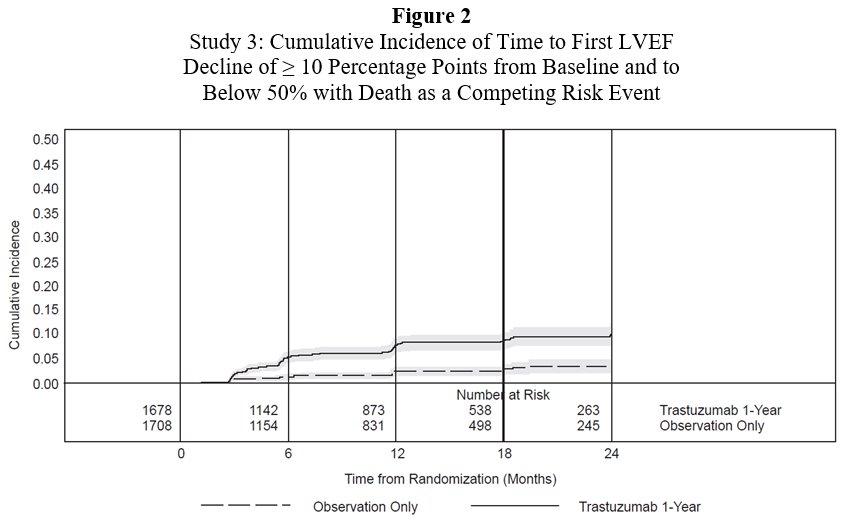
Figure 1 Studies 1 And 2: Cumulative Incidence Of Time To First Lvef (Image 01)
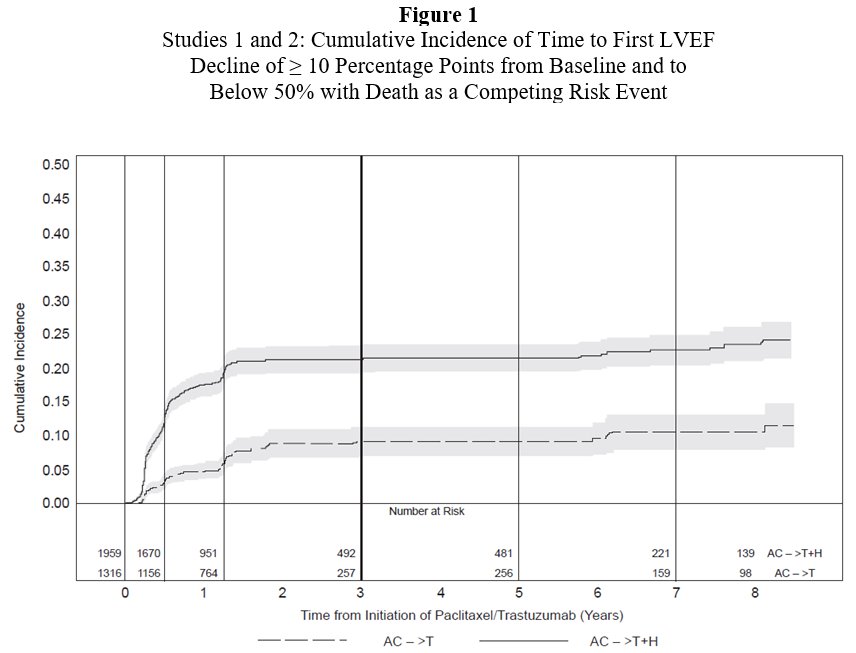
The text describes a graph (Figure 1) which displays the cumulative incidence of time to first LVEF decline from baseline and to below 50% with death as a competing risk event, for studies 1 and 2. The graph shows the time in years from the initiation of Pacitaxel/Trastuzumab, and the number of risks on the y-axis. The x-axis displays the years from 0 to 8. There are also some numbers (900, 1959, 1670, etc.) on the top and bottom of the graph.*