Dabigatran Etexilate Capsule, Coated Pellets
Product Images NDC 67877-475

10 FDA label images from Ascend Laboratories, Llc · Packaging, Regulatory Labels, and Product Appearance

Product Visual Gallery

This gallery contains 10 technical images submitted to the FDA as part of the official labeling for Dabigatran Etexilate (NDC 67877-475). Unlike standard consumer photos, these assets often include clinical data figures, molecular chemical structures, and official manufacturer packaging layouts.

As provided by Ascend Laboratories, Llc, these visuals offer a comprehensive scientific overview of the product's physical and chemical identity, aiding pharmacists and researchers in product verification and study.

FDA Label Image

Dab-igatran-f1-2 (Dab Igatran F1 2)
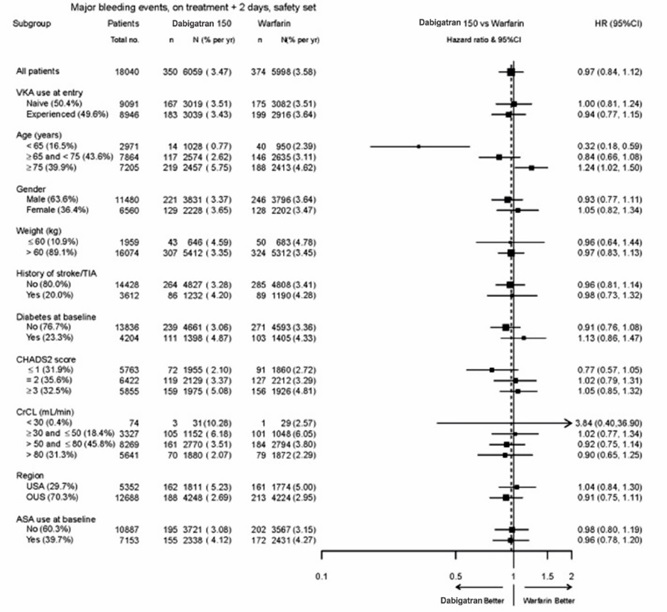
Dab-igatran-f1-2 (Dab Igatran F1 2)
A forest plot chart comparing major bleeding events for Dabigatran 150 mg versus Warfarin across various patient subgroups. It displays hazard ratios with 95% confidence intervals for factors including VKA use, age, gender, weight, history of stroke/TIA, diabetes, CHADS2 score, renal function (CrCL), region, and ASA use, with markers indicating comparative safety outcomes.*
FDA Label Image

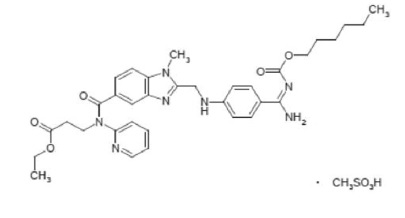
Dab-igatran-str (Dab Igatran Str)

Dab-igatran-str (Dab Igatran Str)
Chemical structure of Dabigatran Etexilate, the active ingredient shown in the image as a molecular diagram with specific functional groups and atoms, including a sulfonic acid moiety represented as CH3SO3H.*
FDA Label Image

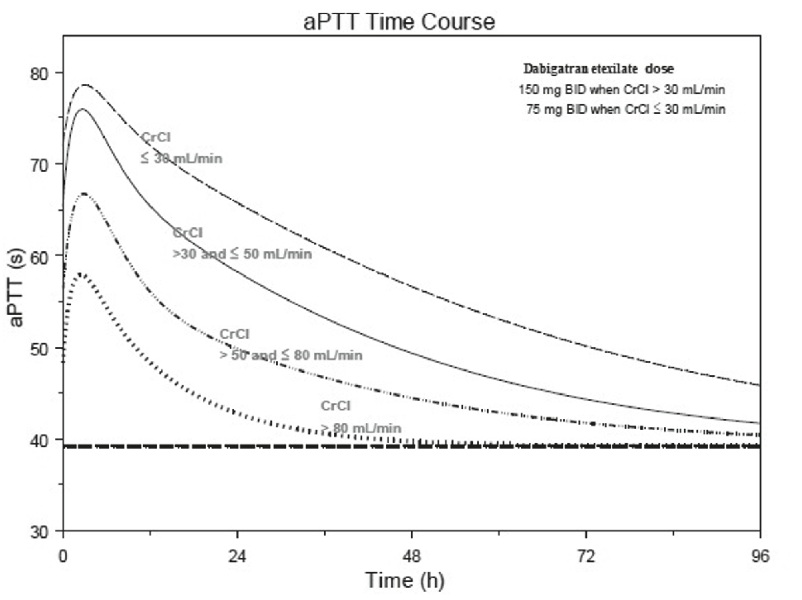
Dab-igatran-fig2-3 (Dab Igatran Fig2 3)

Dab-igatran-fig2-3 (Dab Igatran Fig2 3)
Line graph showing the aPTT (activated partial thromboplastin time) time course in seconds over 96 hours for Dabigatran etexilate doses of 150 mg BID when CrCl is greater than 30 mL/min and 75 mg BID when CrCl is less than or equal to 30 mL/min. The graph depicts aPTT values stratified by creatinine clearance categories (>80, >50 and ≤80, >30 and ≤50, ≤30 mL/min), illustrating the effect of renal function on the aPTT over time.*
FDA Label Image

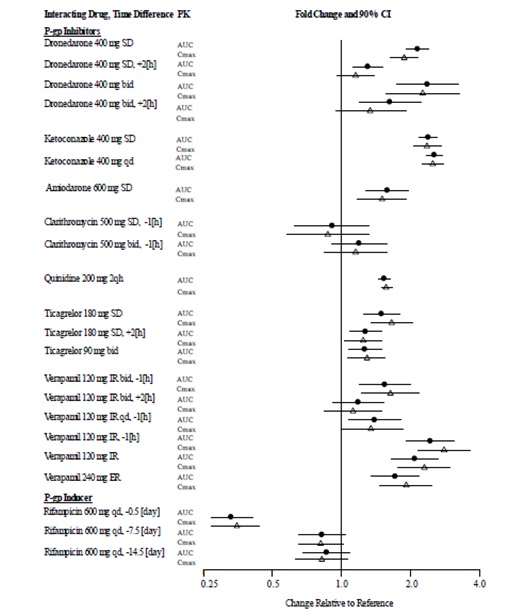
Dab-igatran-graph4-2 (Dab Igatran Graph4 2)

Dab-igatran-graph4-2 (Dab Igatran Graph4 2)
A forest plot chart titled 'Interacting Drug, Time Difference PK' showing fold change and 90% confidence intervals for various P-gp inhibitors and inducers on pharmacokinetic parameters AUC and Cmax relative to reference. The x-axis represents the fold change relative to reference on a logarithmic scale from 0.25 to 4.0. Drugs listed include Dronedarone, Ketoconazole, Amiodarone, Clarithromycin, Quinidine, Ticagrelor, Verapamil, and Rifampicin with different doses and time points. Data points are plotted with associated confidence intervals, illustrating the effect of each interacting drug on these pharmacokinetic measures.*
FDA Label Image

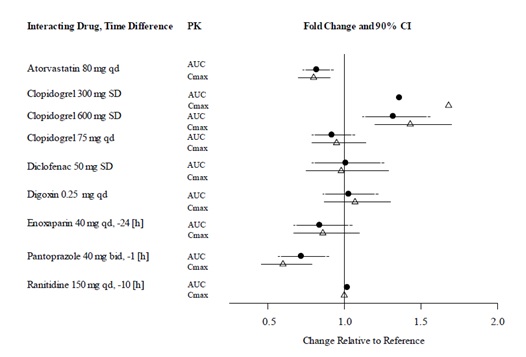
Dab-igatran-fi-3-2 (Dab Igatran Fi 3 2)

Dab-igatran-fi-3-2 (Dab Igatran Fi 3 2)
A pharmacokinetic interaction graph depicting fold change and 90% confidence intervals for various interacting drugs with Dabigatran Etexilate. The plot compares AUC and Cmax values relative to a reference, showing changes for Atorvastatin, Clopidogrel (multiple doses), Diclofenac, Digoxin, Enoxaparin, Pantoprazole, and Ranitidine at specified doses and times.*
FDA Label Image

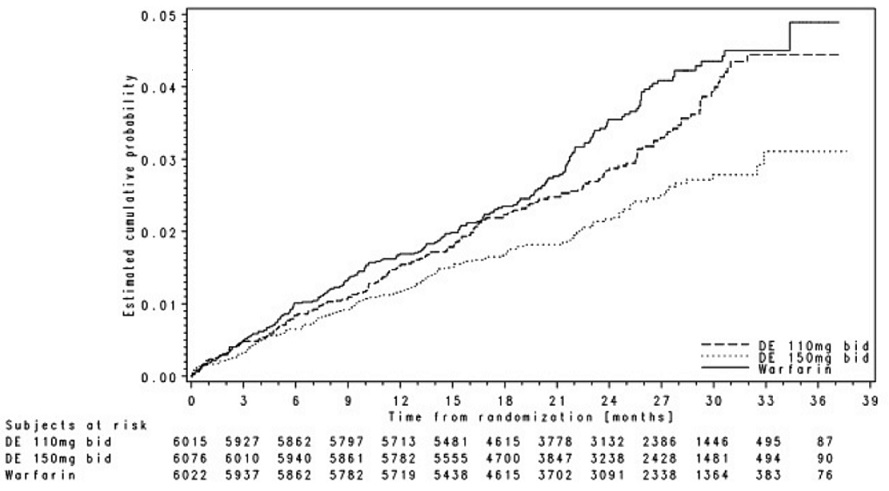
Dab-igatran-fi-4-1-2 (Dab Igatran Fi 4 1 2)

Dab-igatran-fi-4-1-2 (Dab Igatran Fi 4 1 2)
A Kaplan-Meier plot showing estimated cumulative probability over time from randomization in months. The graph compares three treatments: Dabigatran Etexilate (DE) 110 mg twice daily, DE 150 mg twice daily, and Warfarin. The x-axis represents time in months up to 39 months, and the y-axis shows the cumulative probability from 0 to 0.05. A table below the graph lists the number of subjects at risk for each treatment at various time points.*
FDA Label Image

Figure 5 (Dab Igatran Fig5 3)

Figure 5 (Dab Igatran Fig5 3)
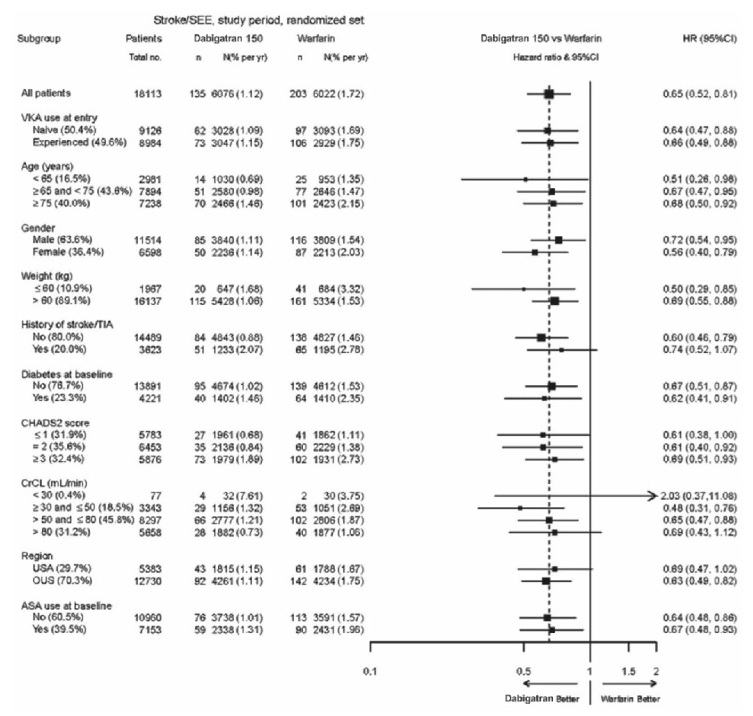
A forest plot chart comparing the risk of stroke or systemic embolic events (SEE) between Dabigatran 150 mg and Warfarin across various patient subgroups. The chart shows hazard ratios (HR) with 95% confidence intervals, indicating the relative effectiveness of Dabigatran versus Warfarin in categories such as age, gender, weight, history of stroke/TIA, diabetes status, CHADS2 score, renal function, region, and ASA use at baseline.*
FDA Label Image

Dabigatran-75-mg-container (Dabigatran 75 mg Container)

Dabigatran-75-mg-container (Dabigatran 75 mg Container)
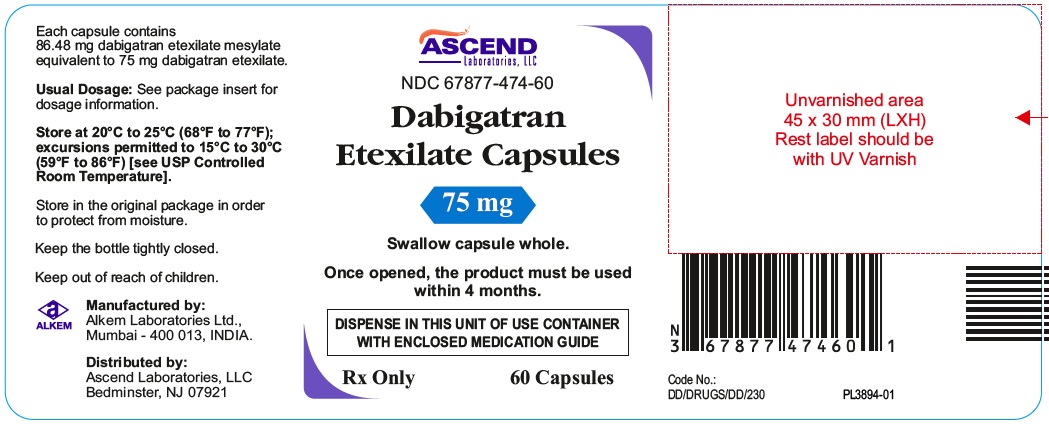
Label for Dabigatran Etexilate Capsules 75 mg from Ascend Laboratories, LLC. The label includes dosage strength, storage instructions, manufacturer and distributor information, and barcode. It specifies the capsule form as coated pellets and indicates packaging instructions and usage guidelines.*
FDA Label Image

Dabigatran-110-mg-container (Dabigatran 110 mg Container)

Dabigatran-110-mg-container (Dabigatran 110 mg Container)
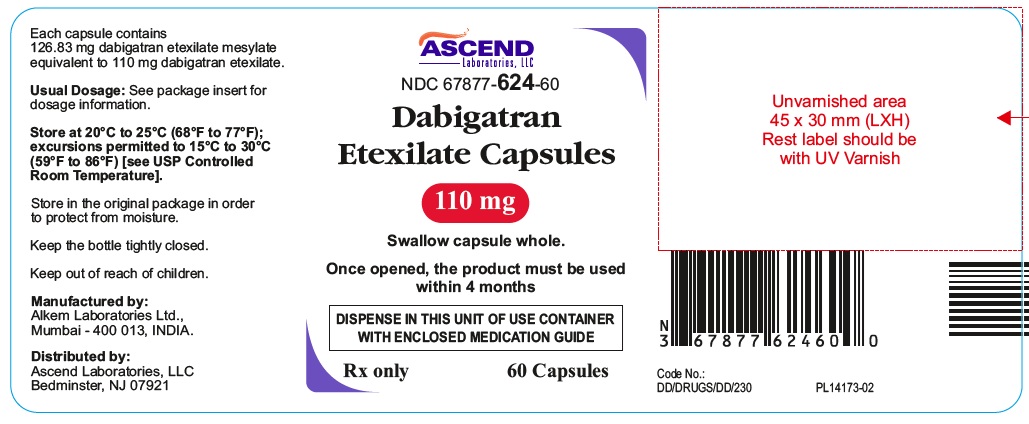
Label for Dabigatran Etexilate Capsules 110 mg by Ascend Laboratories, LLC. The label states each capsule contains 126.83 mg dabigatran etexilate mesylate equivalent to 110 mg dabigatran etexilate. The package contains 60 capsules. Manufacturer is Alkem Laboratories Ltd., India. It includes storage instructions and a barcode.*
FDA Label Image

Dabigatran-150-mg-container (Dabigatran 150 mg Container)

Dabigatran-150-mg-container (Dabigatran 150 mg Container)
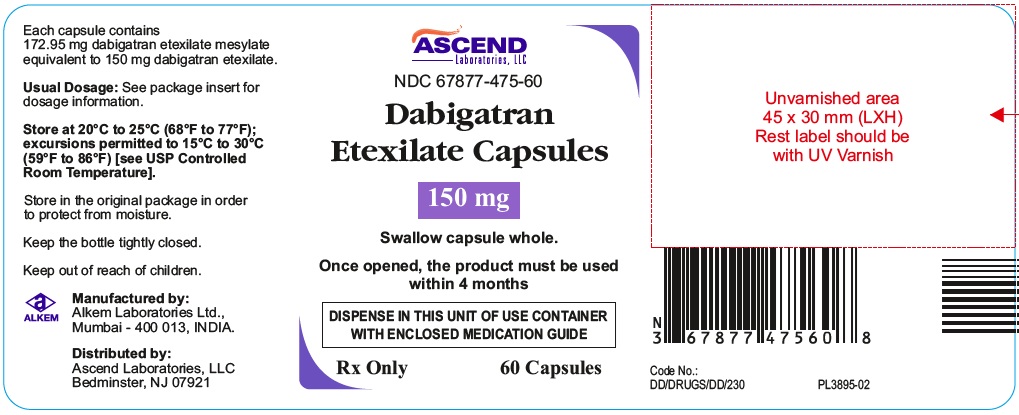
Label for Dabigatran Etexilate Capsules 150 mg by Ascend Laboratories, LLC. The label displays storage instructions, dosage note, manufacturer Alkem Laboratories, India, and distributor information. It indicates a 60-capsule count and includes a barcode, NDC number 67877-475-60, and usage guidance to swallow the capsule whole and use within 4 months after opening.*

* About these descriptions: Image descriptions on this page are generated by automated AI analysis of the product label images from the manufacturer's FDA label submission (SPL). They are provided for reference only and may contain errors or omissions. Always rely on the printed label itself and the official FDA labeling, and consult a pharmacist or healthcare professional with any questions about this product.