Sildenafil Citrate Powder, For Suspension
Product Images NDC 67877-648

14 FDA label images from Ascend Laboratories, Llc · Packaging, Regulatory Labels, and Product Appearance

Product Visual Gallery

This gallery contains 14 technical images submitted to the FDA as part of the official labeling for Sildenafil Citrate (NDC 67877-648). Unlike standard consumer photos, these assets often include clinical data figures, molecular chemical structures, and official manufacturer packaging layouts.

As provided by Ascend Laboratories, Llc, these visuals offer a comprehensive scientific overview of the product's physical and chemical identity, aiding pharmacists and researchers in product verification and study.

FDA Label Image

Sildenafil Cart 2

Sildenafil Cart 2
Label for Sildenafil for Oral Suspension 10 mg/mL powder for suspension, grape flavored, by Ascend Laboratories, LLC. The label states it is for oral use only and requires shaking before each use. The bottle contains 112 mL following reconstitution. Manufacturer is Alkem Laboratories Ltd., Mumbai, India, with distribution by Ascend Laboratories, Parsippany, NJ.*
FDA Label Image

Sildenafil Cont 2

Sildenafil Cont 2
The label for Sildenafil Citrate Oral Suspension 10 mg/mL by Ascend Laboratories, LLC. It provides storage instructions before and after reconstitution, specifies a 112 mL volume following reconstitution, and includes a barcode and manufacturer details. The label also highlights this product is for oral use only and prescription use (Rx only).*
FDA Label Image

Sildenafil-fig1 (Sildenafil Fig1)

Sildenafil-fig1 (Sildenafil Fig1)
Illustration showing a graduated cylinder used for measuring liquid, a bottle partially filled with suspension, and an assembled syringe with measurement markings. The diagram likely depicts steps for measuring and drawing Sildenafil Citrate oral suspension 10 mg/mL from a bottle using the syringe provided.*
FDA Label Image

Sildenafil-fig10 (Sildenafil Fig10)

Sildenafil-fig10 (Sildenafil Fig10)
A forest plot chart comparing the placebo-corrected change in 6-minute walk distance for Sildenafil 20 mg TID versus placebo across various patient subgroups. Subgroups include baseline walk distance, etiology of pulmonary arterial hypertension, functional capacity class, gender, age, mean pulmonary artery pressure, and pulmonary vascular resistance index. The chart shows effect sizes with confidence intervals for each subgroup.*
FDA Label Image

Sildenafil-fig11 (Sildenafil Fig11)

Sildenafil-fig11 (Sildenafil Fig11)
A survival curve graph showing the percentage without a clinically worsening event over time (days from randomization) comparing Sildenafil and Placebo groups. The y-axis represents the percentage without worsening events, while the x-axis represents days from randomization up to 112 days. The Sildenafil group maintains a higher percentage without events than the Placebo group throughout the period.*
FDA Label Image

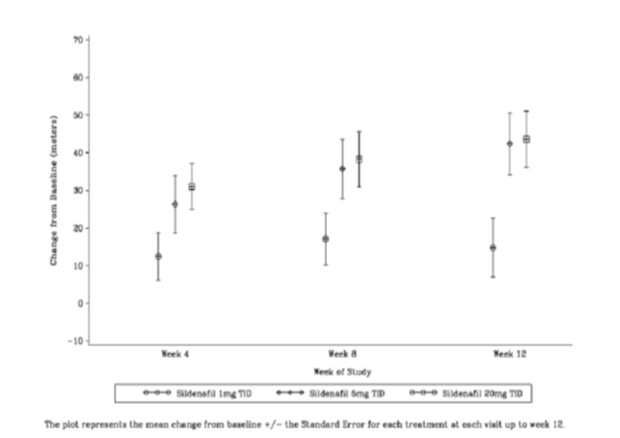
Sildenafil-fig12 (Sildenafil Fig12)

Sildenafil-fig12 (Sildenafil Fig12)
A line graph showing the mean change from baseline in meters over weeks 4, 8, and 12 in a study of Sildenafil at doses 1 mg TID, 5 mg TID, and 20 mg TID. Error bars indicate standard error for each treatment at each visit up to week 12.*
FDA Label Image

Sildenafil-fig2 (Sildenafil Fig2)

Sildenafil-fig2 (Sildenafil Fig2)
An instructional diagram showing three steps for handling a medication bottle. The first step demonstrates twisting off the cap. The second step shows shaking the bottle up and down to mix the contents. The third step displays a stopwatch indicating timing, likely for measuring or waiting before administering the medication.*
FDA Label Image

Sildenafil-fig4 (Sildenafil Fig4)

Sildenafil-fig4 (Sildenafil Fig4)
An instructional diagram showing how to prepare a suspension from a bottle. It depicts pressing and twisting the cap to open, shaking the bottle up and down and rotating it to mix, and a stopwatch indicating a waiting time, presumably for proper suspension preparation.*
FDA Label Image

Sildenafil-fig5 (Sildenafil Fig5)

Sildenafil-fig5 (Sildenafil Fig5)
An instructional illustration showing how to open a child-resistant closure on a bottle. The first image shows pressing down on the cap before turning, and the second image depicts twisting the cap to open the bottle, demonstrating child safety bottle opening techniques.*
FDA Label Image

Sildenafil-fig6 (Sildenafil Fig6)

Sildenafil-fig6 (Sildenafil Fig6)
A line chart depicting the estimated cumulative mortality rate (%) over time in years for three dose groups: High Dose, Medium Dose, and Low Dose. The graph shows an increasing mortality rate over five years, with the High Dose group having the highest rate, followed by Medium and Low Dose groups. Number at risk counts are provided above the chart for each group at different time points.*
FDA Label Image

Sildenafil-fig7 (Sildenafil Fig7)

Sildenafil-fig7 (Sildenafil Fig7)
A chart displaying drug interaction effects on Sildenafil Citrate pharmacokinetics. It shows fold change with 90% confidence intervals for AUC and Cmax values relative to Sildenafil alone, for various interacting drugs including Atorvastatin, Azithromycin, Bosentan, Cimetidine, Erythromycin, Maalox, Oral Contraceptives, Ritonavir, and Saquinavir. Recommendations on dose adjustment accompany each interaction.*
FDA Label Image

Sildenafil-fig8 (Sildenafil Fig8)

Sildenafil-fig8 (Sildenafil Fig8)
A chart displaying fold change and 90% confidence intervals for various interacting drugs with sildenafil citrate, indicating changes in parameters such as INR, AUC, Cmax, and bleeding time relative to the interacting drug alone. Recommendations on dose adjustments or coadministration are provided for each interacting drug.*
FDA Label Image

Sildenafil-fig9 (Sildenafil Fig9)

Sildenafil-fig9 (Sildenafil Fig9)
A line graph showing changes from baseline in a measured variable over weeks 4, 8, and 12 of a study. The x-axis is labeled 'Week of Study,' and the y-axis represents 'Change from Baseline (hectares).' Four different groups are compared: Placebo, Sildenafil 20 mg TID, Sildenafil 40 mg TID, and Sildenafil 80 mg TID, as indicated in the legend. Error bars show variability in measurements at each time point.*
FDA Label Image

Sildenafil Figure 3

Sildenafil Figure 3
An instructional diagram showing a graduated cylinder next to an open bottle and a syringe-like measuring device with volume markings, indicating the preparation or measurement of a liquid suspension dose.*

* About these descriptions: Image descriptions on this page are generated by automated AI analysis of the product label images from the manufacturer's FDA label submission (SPL). They are provided for reference only and may contain errors or omissions. Always rely on the printed label itself and the official FDA labeling, and consult a pharmacist or healthcare professional with any questions about this product.