Sacubitril And Valsartan Tablet, Film Coated
Product Images NDC 67877-950

View Photos of Packaging, Regulatory Labels, and Product Appearance

Product Visual Gallery

This gallery contains 12 technical images submitted to the FDA as part of the official labeling for Sacubitril And Valsartan (NDC 67877-950). Unlike standard consumer photos, these assets often include clinical data figures, molecular chemical structures, and official manufacturer packaging layouts.

As provided by Ascend Laboratories, Llc, these visuals offer a comprehensive scientific overview of the product's physical and chemical identity, aiding pharmacists and researchers in product verification and study.

FDA Label Image

97 mg/103 mg 180 Tablets Lablel (Sacu 97 103 180 1)

97 mg/103 mg 180 Tablets Lablel (Sacu 97 103 180 1)
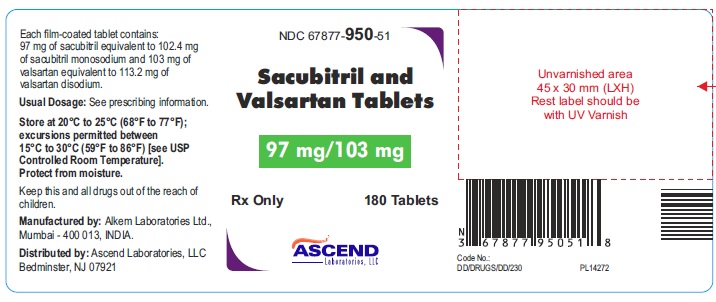
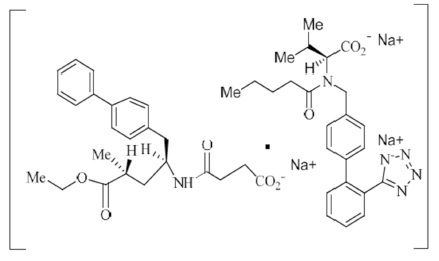
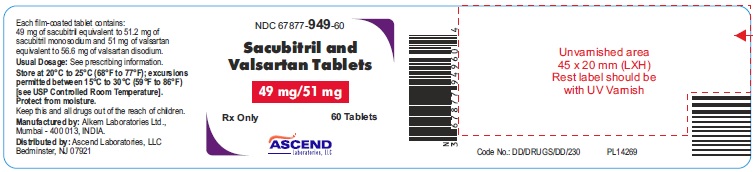
This text appears to be a product label for medication. It indicates the dosage, storage conditions, and ingredients of a drug containing sacubitril and valsartan. The standard dosage, storage temperature range, and manufacturer details are also provided. It is important to follow the recommended dosage instructions and storage conditions for the medication to maintain its effectiveness.*
FDA Label Image

Sacu-fig-a-1 (Sacu Fig A 1)

Sacu-fig-a-1 (Sacu Fig A 1)
This text describes a figure showing the time to the first occurrence of cardiovascular death or heart failure hospitalizations in the PARADIGM-HF study. The results show a significant difference with a p-value of <0.0001. The hazard ratio (HR) was 0.80 (95% confidence interval: 0.73, 0.87) favoring Sacubitril and Valsartan treatment compared to Enalapril. The figure depicts the number at risk over time since randomization in days.*
FDA Label Image

Sacu-fig-b-1 (Sacu Fig B 1)

Sacu-fig-b-1 (Sacu Fig B 1)
This is a description of the Time to Occurrence of Cardiovascular Death data in the PARADIGM-HF study. The figure displays hazard ratio (HR) with a 95% confidence interval of 0.80 (0.71, 0.89) for the use of Sacubitril and Valsartan compared to Enalapril. The graph shows the number at risk and time since randomization in days for both treatment groups. This analysis provides valuable information about the impact of each treatment on cardiovascular death in heart failure patients.*
FDA Label Image

Sacu-fig-c-2 (Sacu Fig C 2)

Sacu-fig-c-2 (Sacu Fig C 2)
This is a figure showing the time to the first occurrence of heart failure hospitalizations in the PARADIGM-HF study. The data includes hazard ratio (HR) with a 95% confidence interval, comparing Enalapril and Sacubitril with Valsartan over different time periods since randomization in days. The figure also provides the number of patients at risk for each treatment group at various time points.*
FDA Label Image

Sacu-figure-4-c (Sacu Figure 4 C)

FDA Label Image

Sacu-figure1 (Sacu Figure1)

Sacu-figure1 (Sacu Figure1)
This text provides a list of coadministered drugs, including Furosemide, Warfarin, Digoxin, Carvedilol, Levonorgestrel, Ethinyl estradiol, Amlodipine, HCTZ, Metformin, Atorvastatin, and Sildenafil. It also mentions the Geometric Mean Ratio and 90% confidence interval. The text seems to describe pharmacokinetic parameters like AUC and Cmax for the listed drugs in relation to a reference. It may be related to a study or analysis of drug interactions.*
FDA Label Image

Sacu-figure2 (Sacu Figure2)

Sacu-figure2 (Sacu Figure2)
Population Description: This text provides information on various factors such as renal impairment, hepatic impairment, age range, gender distribution, and ethnicity in the population being discussed. The document seems to contain data related to geometric mean ratio, percentages, and various categories of impairments based on renal and hepatic function. Additionally, it includes age ranges, gender distribution, and ethnicity comparisons between Asian (Japanese and Chinese) and Caucasian populations, as well as Black/Caucasian and Hispanic populations. The text may be part of a study or report analyzing these characteristics in a specific population.*
FDA Label Image

Sacu-figure5-a (Sacu Figure5 A)

Sacu-figure5-a (Sacu Figure5 A)
This text provides data on the mean number of events per 100 patients in a study related to Total Heart Failure Hospitalizations and CV Death in PARAGON-HF comparing Valsartan and Sacubitril and Valsartan over a period of time since randomization in days. The graph may show the incidence or progression of heart failure hospitalizations and cardiovascular death rates among the patients studied.*
FDA Label Image

Sacu-figure6-a (Sacu Figure6 A)

FDA Label Image

Sacu-figure7 (Sacu Figure7)

FDA Label Image

Structure (Sacu Structure)

FDA Label Image

49 mg/51 mg 60 Tablets Label (Sacu Val 49 51 60tab A)

* These product label images have been analyzed using experimental machine learning. Please verify findings with the primary label text.