Trospium Chloride Capsule, Extended Release
Product Images NDC 68001-427

View Photos of Packaging, Regulatory Labels, and Product Appearance

Product Visual Gallery

This gallery contains 7 technical images submitted to the FDA as part of the official labeling for Trospium Chloride (NDC 68001-427). Unlike standard consumer photos, these assets often include clinical data figures, molecular chemical structures, and official manufacturer packaging layouts.

As provided by Bluepoint Laboratories, these visuals offer a comprehensive scientific overview of the product's physical and chemical identity, aiding pharmacists and researchers in product verification and study.

FDA Label Image

Trospium Chloride Er Capsules Rev 02/20 (Trospium Er Jpg)
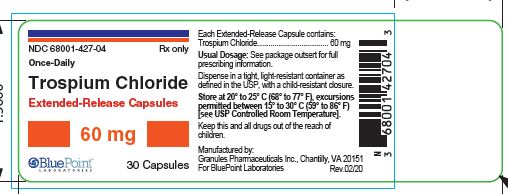
Trospium Chloride Er Capsules Rev 02/20 (Trospium Er Jpg)
Trosium Chloride Extended-Release Capsules 60 mg, oral dosage form, supplied by Bluepoint Laboratories. The label shows the capsule strength, quantity of 30 capsules per container, and includes storage instructions and manufacturing information from Granules Pharmaceuticals Inc.*
FDA Label Image

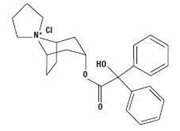
Trosoiumstructure-jpg (Trospium Stucture Jpg)

Trosoiumstructure-jpg (Trospium Stucture Jpg)
Chemical structure diagram depicting the molecular composition of Trospium Chloride, showing ring and functional groups consistent with the compound's known structure.*
FDA Label Image

Trospiumgraph1-jpg (Trospiumgraph1 Jpg)

Trospiumgraph1-jpg (Trospiumgraph1 Jpg)
A line graph showing plasma concentration (mg/mL) over time (hours post-dose) for Trospium chloride extended-release capsules 60 mg. The graph depicts concentration rising to a peak around 4 to 6 hours post-dose, then gradually declining to lower levels by 24 hours, with error bars indicating variability at each time point.*
FDA Label Image

Trospiumgraph2-jpg (Trospiumgraph2 Jpg)

Trospiumgraph2-jpg (Trospiumgraph2 Jpg)
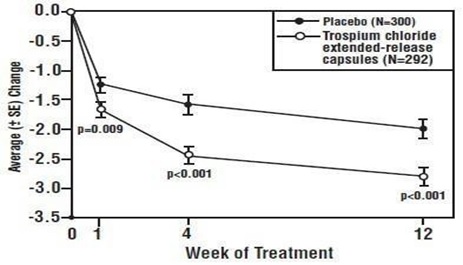
A line graph comparing average change over weeks of treatment between placebo and Trospium chloride extended-release capsules. The x-axis represents weeks of treatment (0, 1, 4, 12), and the y-axis represents average change with standard error. Data points indicate statistical significance values at various weeks.*
FDA Label Image

Trospiumgraph3-jpg (Trospiumgraph3 Jpg)

Trospiumgraph3-jpg (Trospiumgraph3 Jpg)
A line graph showing the average percentage change over weeks of treatment comparing placebo (N=300) and Trospium chloride extended-release capsules (N=292). The x-axis represents weeks of treatment (0, 1, 4, 12), and the y-axis shows average percentage change with standard error bars. Statistically significant differences are indicated at various points with p-values less than 0.01.*
FDA Label Image

Trospiumgraph4-jpg (Trospiumgraph4 Jpg)

Trospiumgraph4-jpg (Trospiumgraph4 Jpg)
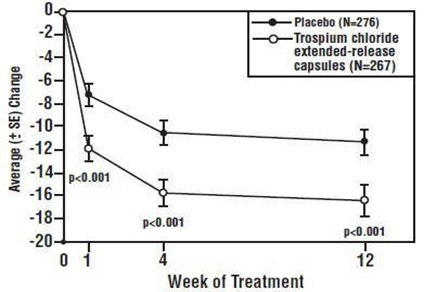
A line graph comparing the average change over time between placebo and trospium chloride extended-release capsules in a treatment study. The x-axis shows weeks of treatment at 0, 1, 4, and 12 weeks, and the y-axis indicates the average plus/minus standard error change. Data points mark differences with accompanying p-values at various time points for both groups of 267 subjects.*
FDA Label Image

Trospiumgraph5-jpg (Trospiumgraph5 Jpg)

Trospiumgraph5-jpg (Trospiumgraph5 Jpg)
A line graph depicting the average change over weeks of treatment comparing placebo and Trospium chloride extended-release capsules. The x-axis shows weeks 0, 1, 4, and 12, while the y-axis shows average change values. Two lines represent placebo (N=276) and Trospium chloride extended-release capsules (N=267), with Trospium chloride showing a greater decrease in average values at each time point.*

* About these descriptions: Image descriptions on this page are generated by automated AI analysis of the product label images from the manufacturer's FDA label submission (SPL). They are provided for reference only and may contain errors or omissions. Always rely on the printed label itself and the official FDA labeling, and consult a pharmacist or healthcare professional with any questions about this product.