Capecitabine Tablet, Film Coated
Product Images NDC 68001-487

View Photos of Packaging, Regulatory Labels, and Product Appearance

Product Visual Gallery

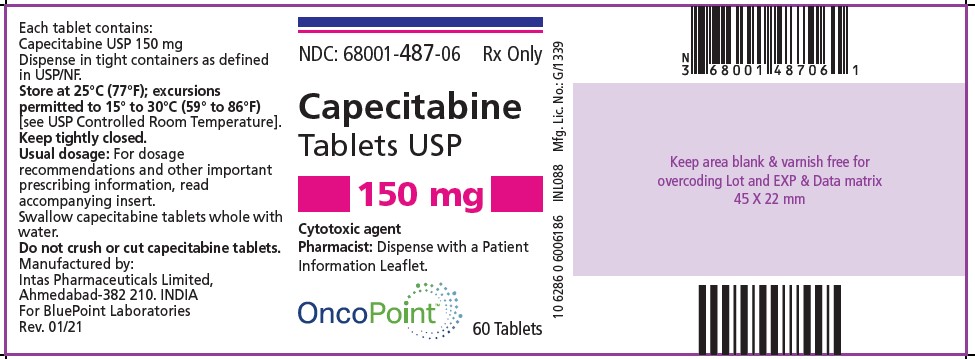
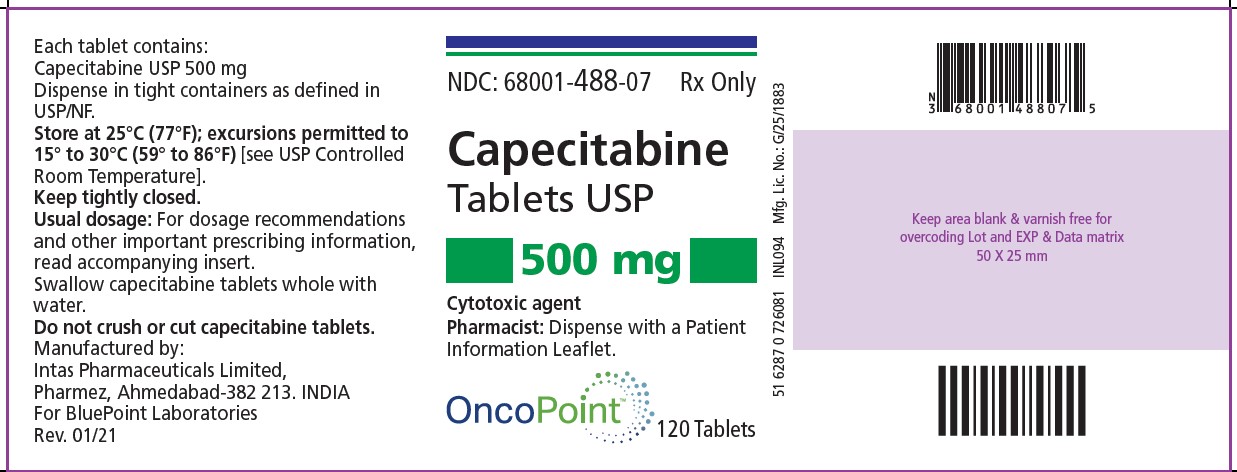
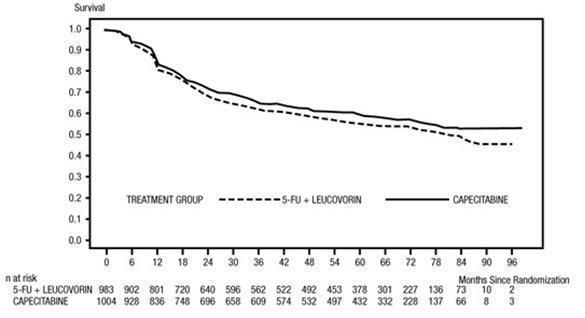
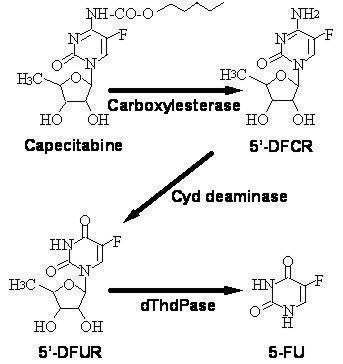
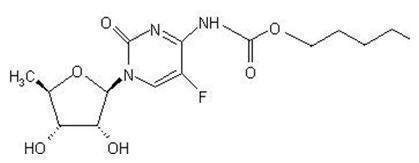
This gallery contains 10 technical images submitted to the FDA as part of the official labeling for Capecitabine (NDC 68001-487). Unlike standard consumer photos, these assets often include clinical data figures, molecular chemical structures, and official manufacturer packaging layouts.

As provided by Bluepoint Laboratories, these visuals offer a comprehensive scientific overview of the product's physical and chemical identity, aiding pharmacists and researchers in product verification and study.

FDA Label Image

Capecitabine Tablets Usp 150mg (ndc 68001 487 06) Rev 0921 Intas Pharmez Site

FDA Label Image

Capecitabine Tablets 150mg 60's Bottle Label (Capecitabine 150 Label)

Capecitabine Tablets 150mg 60's Bottle Label (Capecitabine 150 Label)
Each tablet contains 150mg of Capecitabine, a cytotoxic agent. The tablets should be swallowed whole with water and should not be crushed or cut. It is recommended to store the tablets in tight containers and in controlled room temperature between 15°C - 30°C. For proper dosage and prescribing information, please refer to the accompanying insert. These tablets are manufactured by Intas Pharmaceuticals Limited, Ahmedabad-382 210, INDIA, for BluePoint Laboratories. Total quantity in one package is 60 Tablets.*
FDA Label Image

Capecitabine Tablets 500mg 120's Bottle Label (Capecitabine 500 Label)

FDA Label Image

Figure 1 (Capecitabine Fig1)

FDA Label Image

Figure 2 (Capecitabine Fig2)

Figure 2 (Capecitabine Fig2)
The text is not readable.*
FDA Label Image

Figure 3 (Capecitabine Fig3)

Figure 3 (Capecitabine Fig3)
The provided text represents a chart displaying estimated probabilities for a certain treatment (namely, 5-FU + Leucovorin or Capecitabine at 1250mg/sqm e daily) administered intermittently over a period of time. The x-axis represents time in days, with values ranging from 0 to 1500. The y-axis represents estimated probability percentages, with values ranging from 0.0 to 10.0. The chart indicates that the treatment's effectiveness is expected to improve over time, with higher probabilities associated with longer periods of treatment.*
FDA Label Image

Figure 4 (Capecitabine Fig4)

FDA Label Image

Figure 5 (Capecitabine Fig5)

FDA Label Image

Chemical Structure (Capecitabine Met Path)

FDA Label Image

Chemical Structure (Capecitabine Str)

* These product label images have been analyzed using experimental machine learning. Please verify findings with the primary label text.